Current trends and the outlook for Agriculture
Mr. Michael Carroll
General Manager Agribusiness, National Australia Bank
1. Introduction
This presentation brings together the key points from a number of presentations we have delivered at conferences such as ABARE’s Outlook conference and the Grasslands Mac Troup Memorial lecture.
2. ABARE Outlook
The ABARE’s 2005 Outlook talk received a lot of media coverage which focused primarily on one aspect - the decline in farm numbers.

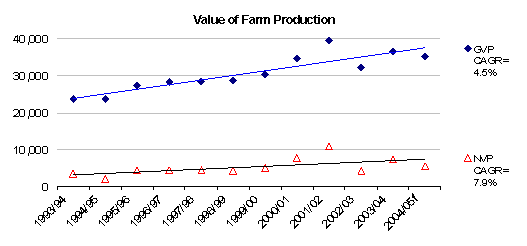
Source: Neil Clarke & Associates, ABS
Over the last 15 years we have lost around 30,000 farms - one and a half farms a day – three farmers every two days. And if we extrapolate out to 2020 there will only be approximately 100,000 farms remaining in Australia. While inflation is at play here, farms with turnover of less than $100k are disappearing while farms with turnover of greater than $100k are increasing in number.
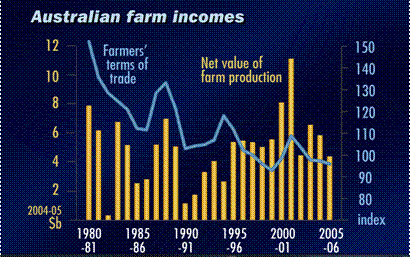
What I would have preferred to see as the news head lines is the positive message in my talk and that is that agriculture’s contribution to the economy is growing at a very healthy rate. Over the last decade the Gross and Net Value of Agricultural Production has increased by 4.5% p.a. and 7.9% p.a[1]
Source: NAB Economics, ABS
I would also have like to hear more about the studies another local, Mick Keogh, initiated. The Farm Policy Research Institute has highlighted the very important fact that while Agriculture only contributes 3.2% of GDP[2], if you include farm dependent food and fibre value adding activity over 12% of the economy (GDP) is dependent on agriculture.
And with a decreasing number of farms the average gross and net value of production per farm has increased by 5.1% p.a. and 8.5% p.a. over the last decade. So the end result is that a decreasing number of farms are contributing an increasing value of production.
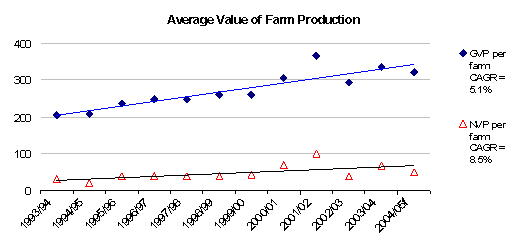
Source: NAB Economics, ABS
An important insight from these charts is that the NVP is growing at a faster rate than the GVP – this reflects a farmer’s ability to produce more output from each unit of costs.
I’d also like to revisit some analysis which I presented at an earlier Outlook conference which compared the wealth created from an investment in agriculture to alternative investments.
Farm Value Creation versus Other Asset Categories
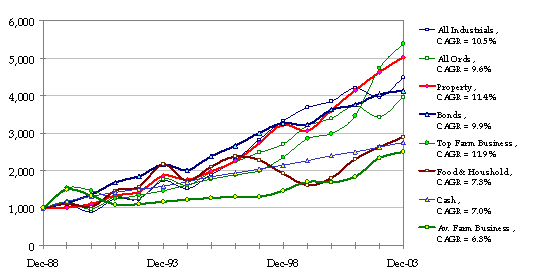
Source: IRESS, ABARE Farm Surveys
This analysis is quite theoretical (e.g. it assumes you can run a dividend reinvestment plan on a farm), however it provides an “apples with apples” comparison of the value accumulated over 15 years from investing $1000 in a number of different investment options. Often when farm performance is assessed the capital gain is ignored whereas with shares it is the capital gain that tends to focused on and the dividend that overlooked.
What it shows is that, if your performance is in the top quartile broad acre farms have created wealth at a rate which is competitive with many alternative investments.
While these figures are a little out of date, at this years Outlook conference Rhonda Treadwell presented a similar conclusion from ABARE’s more current analysis.
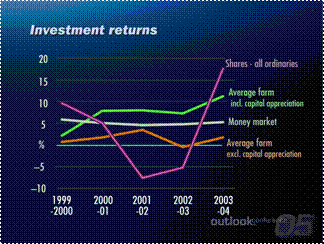
Source: ABARE
Rhonda’s analysis shows that farm returns have been comparable to alternative investments over the previous five years. Note, however, that much of the return has come from capital appreciation. The following chart shows the appreciation in land values.
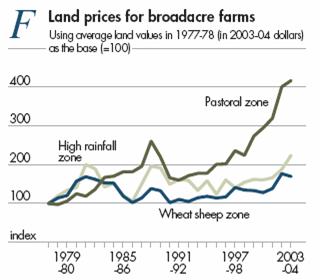
Source: ABARE
What stands out is the extremely strong growth in northern cattle properties. Herron Todd White’s analysis of these property indicates a relationship which in round numbers translates to land values increasing by $15 dollars per ha six months after each 10 cents / kg live weight increase in cattle prices. The correlation between cattle prices and land values has been very strong[3].
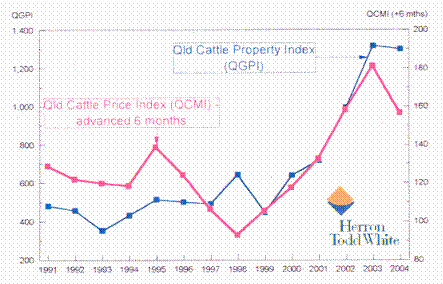
Source: NLRS, HTS Research
I also believe that interest is an important factor in property values. For the last few year’s long term rates – 10 and 15 years – have been at very low levels.
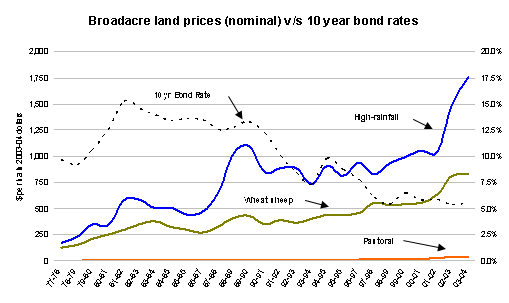
Source: NAB Treasury Solutions, ABARE
Are property values inflated? If you are an average performer – yes, but not if you are in the 25th quartile of performance. The people who tend to win at auction have generated higher returns from farming than they could if they invested their money elsewhere.
3. Forces shaping the future of agriculture
Returning to the consolidation of farm - what is it that is driving farming families out of the industry – I believe it is a combination of factors. There are pressures on some families to leave their farm, the optimal size for a farm is increasing and there are significant entry costs for those wanting to get into farming.
1) A long run trend of declining terms of trade and the inability of many farmers to find offsetting productivity gains has caused many farms to become unviable– particularly the smaller and the less efficient farms with the final straw being a prolonged trough in prices or successive adverse seasons;
Source: ABARE
2) Another key factor is the desire for equitable intergenerational transfer which means a typical family farm must increase its asset base and the “real” profit generated by 2 or 3 times every 30 to 40 years. Whereas once daughters may have accepted their brothers receiving the lions’ share of the family assets this is no longer the case;
3) The large and growing equity requirement of traditional farming enterprises is out of reach of many aspiring new farmers. The minimum investment is around $1.5 million for a viable farm;
I’d also like to touch on another factor which I believed is increasingly contributing to farm consolidation and that is the increasing array of regulations and codes that farmer are expected to comply with. They are a real challenge for a small family operation. In contrast a corporate farm can segregate these duties to employees who can specialise in this area. And as we’ve learnt at the National, it is the right attitudes and beliefs towards these issues that are far more important than compliance with regulations.
With none of these factors, or their underlying drivers, looking like abating in the future I believe we can expect consolidation to be an enduring characteristic of agriculture.
4. Some of the responses
So how have farmers met these challenges?
- Sadly many have left the industry – over 30,000 in the last 15 years.
- Off farm income – many have looked to off farm income. Indeed around 45% of farms now generate around 30% of their income off farm.
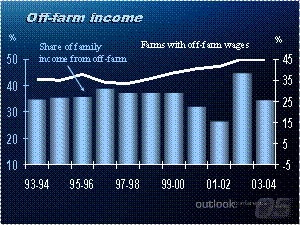
Source: ABARE
- Increasing productivity
Many, particularly the larger and smarter operators, have lifted productivity. Indeed compared to other industries in Australia, agriculture has a fantastic track record in achieving productivity gains – around 2.3% p.a. over the last 35 years. The cropping industry in particular has a strong track record in adapting to change.
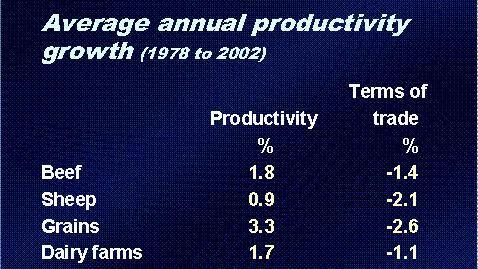
Source: ABARE
- Increasing farm size
One of the key strategies for lifting productivity is to increase the size of the farm so that fixed costs/overheads can be spread over a greater level of production. Over the last 40 years the average property size has increased by over 50%. Each year around 1 in 20 farmers increase the size of their property by around 25%. The recent increase in sales is, I believe, due to strong prices allowing people to leave the industry with high equity and for those wanting to expand, the ability to lock in 10, even 15 year interest rates at historic lows.
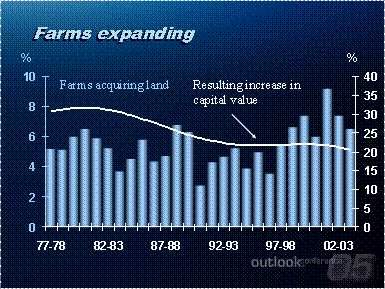
Source: ABARE
Some of our research shows that the number of farmers wanting to expand is three times the number of farmers wanting to sell.
Wanting to purchase additional land |
Wanting to sell land |
|
Specialist beef producers |
19% |
6% |
Specialist sheep producers |
10% |
4% |
Mixed Livestock |
20% |
3% |
Mixed Cropping & Livestock |
18% |
4% |
Specialist Cropping |
19% |
5% |
Source: Annual Survey of around 5,000 NAB customer’s intentions
With a reasonably benign outlook for interest rates, the government’s track record in controlling inflation and the pent up demand for more acres, I don’t envisage a large “correction” in property values.
- Leasing and share farming
Although the most recent statistics I have show that only 6% of agricultural land is leased I sense this growing strongly as is share farming. I also have no doubt that there is a far greater demand than supply with many of our customers unable to find long term leases at rates which allow them a reasonable return. This I find surprising as the extreme ranges we see in farm performance and the extreme ranges we see in enthusiasm for farming means there is a great win-win opportunity here. Top performing enthusiastic farmers can offer the Hanrahans a better return than they are achieving now.
I have no doubt we will follow the US on leasing where I understand around 50% of the land is leased and most of the land lords are descendants of the original property owners. I think we’re a generation behind the US and over the next thirty years leasing and share farming will become farm more prevalent.
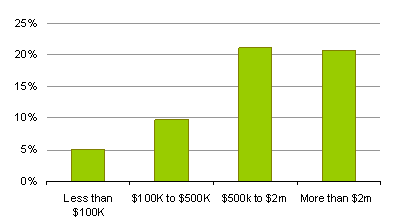
5. Is it a case of get big or get out?
Size isn’t everything and my advice to our customers is – before expansion make sure you are getting the most out of your current assets. The following chart represents that small farms (less than around a $1 million asset base) struggle to generate a positive return and that on average the larger the asset base the greater the return. However, what is really important to be aware of is, the better mid sized farms generate greater returns of 5.9% in percentage terms than the average of their larger peers of 2.8%. Even in dollars the better mid sized farmers generate greater profits ($75k) than the average large farm ($58k).
Scale alone is not a panacea for low returns. Just as important as physical resources are intellectual resources, and perhaps more importantly the inclination to change.
Farm Return on Assets
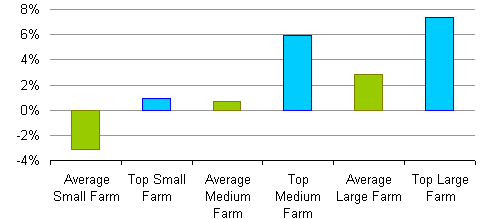
Source: ABARE Farm Surveys average of 2002 to 2004
Indeed this variation in farm performance highlights the enormous potential to improve farm performance. The challenge is to transfer best practice and lift the average performance of the sector to that of the leading edge – clearly the management practices and technology to do this exists.
6. Sustainable debt levels
The ‘get big or get out’ strategy came unstuck in the 1980s due to some farmers borrowing more than they could service through the downturns in seasonal conditions and commodity prices. At the National, we’ve gone to great lengths to develop a credit process that identifies a level of debt which is serviceable on a year-in year-out basis. While we have seen a strong increase in debt over the last 5 years of 14% p.a, average farm debt has remained in line with farm incomes.

Source: ABARE
The following chart shows that most of the increase in debt has been with the larger borrowers. Loans of greater than $500k have grown at more than 20% p.a. My observation is that much of this has been to fund property expansion.
Compound Annual Growth in Farm Borrowings over the five years to Dec ‘04
Source: APRA
Another interesting observation is that farms with debt have consistently outperformed farms without debt.
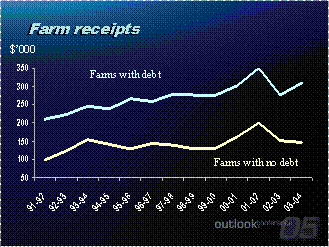
Source: ABARE
A sensible level of debt seems to constructively sharpen the focus. The requirement of banks to see financial statements and cash flow projections encourages you to review your performance. I often say to farmers – very much tongue in check – that compared to listed companies, you have the luxury of not having to optimise your financial performance.
7. Planning for 2030
So to the topic of ‘How do you prepare for the future?’
It would be much easier to prepare for the future if we knew where commodity prices would be in 25 years time. The only thing that I think is certain about future prices is that no one knows.
Exchange rates make up a large component of commodity prices and each year The Age surveys Australia’s most respected economists on their outlook for exchange rates and then follows up their predictions.
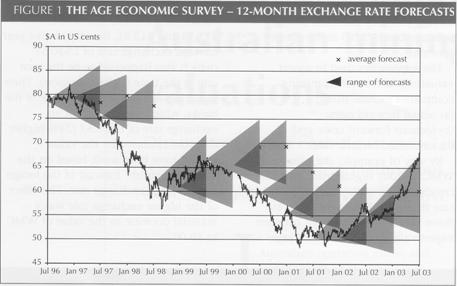
Source: JASSA, Issue 4, Summer 2004, FX Rates in mining company valuations, Wayne Lonergan
My conclusion is that today’s price is as good as any to rely on when completing your business plans, however it is essential that you do some sensitivity analysis around the possible highs and lows of the prices you receive and pay.
I also think that the view that commodity prices are ‘cyclical” is a misnomer. While there is some evidence of a US cattle cycle which is driven by supply and demand, following a 10 to 12 year sell off and herd rebuilding cycle it is not that regular.
I think that commodity prices are best characterised as following a random walk which has a tendency to revert to a long run average that declines in real terms over time. The long run decline is a characteristic of our markets being mature and common to virtually all mature products. Most sources of competitive advantage are quickly replicated and competed away.
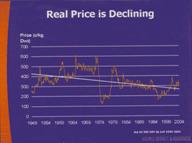
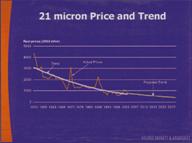
Source: David Sackett, Holmes, Sackett and Associates, Notes from a training program run for National’s Riverina graduates
So whether you are in wool, beef or lamb production I believe that in 25 years time you can count on the prices you receive being significantly lower than they are today in real terms. As a comparison reflect on the purchasing power of a truck load of steers, lambs or wool bales 25 years ago.
The only counter is to improve our productivity.
So this is your challenge. Your long term plans need to reflect declining real prices and the only counter is keep reducing your cost of production. This is why it is essential that if you want to remain in the game you need to keep exploring more efficient production practices and technology options.
8. Pushing the boundaries
So what are these more efficient production practices, what is the new technology? For that you need to look to researchers and to the farmers pushing the boundaries of current technology. What they are doing is likely to be mainstream in the future.
I recall 20 years ago when I was working for Monsanto promoting minimum tillage - selling Roundup the plough in a drum, only around 15% of farmers had adopted what was a radical new approach to crop establishment. Now I understand over 85% of farmers practice minimum tillage.
In recent times I have had the privilege of observing exciting new technology in action:
· GPS navigation technology in tractors – which is reducing the use of herbicides and coupled with controlled traffic systems minimising soil compaction.
· Feeding of liquid fermented grain to pigs – to increase the efficiency with which grain is converted to pork
· Using rainfall derivatives - to offset the yield reduction cost of a dry finish to the winter cereal growing season
· Using soil moisture meters in closed irrigation systems - to maximise water use efficiency and minimise any environmental impact
· Improved soil management practices on dry land farms to maximize the amount of water it can store – the most cost effective place to store water is in the soil
· Using genetically modified organisms – GMO cotton has dramatically reduced the use of endosulphan insecticides and future generation’s have the potential to reduce the use of herbicides
· Using sophisticated computer systems to analyse objective measures of livestock growth, fertility, carcass quality, fed conversion and even temperament to maximise the rate of genetic progress,
· Developing their own branded product – with strong linkages from paddock to plate they’ve been able to refine their product to better meet the customers need and create opportunities for the consumer to hear the story behind what they are eating or wearing.
9. Characteristics of the most productive and successful farms
However what is more important than the technology is attitude and your way of thinking. My observation is that the strongest farms are characterised by:
1. They are on average larger. Scale allows them to reduce their fixed costs relative to their revenue.
2. Perhaps more importantly their ambitions to grow extend them and consequently they stretch their resources to grow.
3. They seek new ideas and outside advice from a wide range of sources - they have inquisitive minds and are receptive to new ideas and looking for new approaches.
4. They get involved in productivity focused groups which enable them and other like minded farmers to explore as a team, solutions to the challenges they face. These groups have addressed the insular nature of farming and filled the void created by the contraction of State extension services.
5. They embrace new technology but do so judiciously – by judiciously I mean they’re not at the “bleeding edge”; they test it and watch others experience’s and when confident of its value are quick to adopt it.
6. The same applies to new species, genetics and varieties.
7. They don’t do things out of habit or tradition – if another product and market is proving to be more profitable then they change (but they don’t chase markets and fads).
8. If some one else can do something more cost effectively then they will outsource the activity – I’ll come back to this.
9. They understand the key value drivers of their business and focus their energy on the things that really make a difference – more often than not this is their cost of production which they continuously reduce.
10. They bench mark their performance. Peer group comparative analysis has increased dramatically over the last decade and been invaluable in challenging farm manager’s performance and future plans. With common management and ownership farm businesses miss out on the healthy tension that exists where business owners employ independent managers to run the business.
11. They also know their market’s requirements and produce to its specifications.
12. They take calculated risks – risks that many may not be prepared to take but always on an informed basis with an appreciation of the downside and usually with a fall back strategy.
13. They set the next generation up to succeed them. Indeed, I believe a key factor in the success of many of today’s leading agricultural enterprises has been their ability to have their children acquire an education and experience that will equips them to make a meaningful contribution to the business. And they embrace their input;
And, perhaps most importantly of all they enjoy what they do.
Looking to the future, I expect these attributes and further adoption of professional business management disciplines. As farm businesses grow in size – and in many cases leverage - the stakes increase and more robust business planning, scenario analysis and feasibility studies of potential changes are necessary.
I also expect a greater use of out-sourcing as farmers continue to “unbundle” the various components of their agricultural business. Rather than continuing the tradition of the farm being self contained in its sources of capital, technical expertise and plant and equipment they can be sourced from outside the families resources:
- Technical expertise – increasingly external technical expertise is being sought from specialist nutritionists, agronomists and marketing advisors.
- Capital – there is a growing trend of share farming, share milking and leasing of land and even livestock.
- Plant and equipment – there is an increasing use of contractors to sow, care for and harvest crops and contract musterer’s to handle livestock.
I was recently on one of the largest irrigated cropping operations in Australia – they don’t own any planting, spraying or harvesting and handling equipment.
10. Concluding Comments
And so for the future – I see no change in the trend of consolidation of agriculture into:
- The hands of those who are proactive rather than reactive.
- Into the hands of those who continuously look for ways to improve their productivity.
- Into the hands of those who accept responsibility for the position they are in rather than expect others to solve their problems.
- Into the hands of those with whom it is a pleasure and often an inspiration to work with.
- And into the hands of those who will ensure agriculture continues to play an important role in the economy providing even cheaper, higher quality, and increasingly available food and fibre.