Australasian Agribusiness Review - Vol.14 - 2006
Paper 8
ISSN 1442-6951
----------------------------------------------------------------------------
Is it Cost Effective to Segregate Canola in WA?
Bronwyn Crowe and Jo Pluske
Bronwyn Crowe is a Research Officer at the School of Agricultural and Resource Economics, University of WA
Dr Jo Pluske, School of Agriculture and Resource Economics, University of WA
Abstract
If genetically modified (GM) canola varieties are to be released for commercial cultivation in Australia, the Australian canola supply chain would have to consider segregation options if it wishes to continue marketing non-GM canola and comply with worldwide labelling requirements. The feasibility of segregation and cost effectiveness of three possible segregation methods is investigated in this paper. In considering each of these methods the increase in total grain handling cost due to segregation is expected to be between 5 and 9 per cent. Such an increase is comparable with segregation costs reported in Canadian literature.
Keywords: canola; genetically engineered crops; segregation; supply chain.
Introduction
Should canola genetically modified (GM) for herbicide resistance be commercially released in Australia, it will be the first GM crop to be grown for human consumption in this country (2003a). On the 25th July 2003 Australia’s Office of the Gene Technology Regulator (OGTR) approved as safe for humans and the environment the GM canola Bayer® CropScience’s® InVigor®, a canola variety genetically modified to be resistant to the herbicide LibertyLink® (gluphosinate) (OGTR 2003c). Monsanto’s® Roundup Ready® canola variety, genetically modified to be resistant to the herbicide Roundup® (glyphosate), was approved by the same Office on 19th December 2003 (OGTR 2003b). Even so, all State Governments in Australia have imposed a moratorium preventing the release of GM canola for broad-scale agriculture and hence commercial release has not yet occurred. Nevertheless, release of varieties is probable with moratoriums in States producing canola to be reviewed in 2006 or 2008.
Australia produced 1,533 kt of canola in 2004, reflecting the average of 1,528 kt per year over the past 5 years (ABARE 2005). Of this 74% or 1,092 kt were exported, principally to Japan (41%), Pakistan (23%), China (13%) and Bangladesh (10%) (ABARE 2005). Australia is seen to benefit from adopting GM canola regardless of the European Union’s strict GM contamination tolerance levels unless North-East Asian countries introduce similar controls on imports (Anderson and Jackson 2005). Currently the European Union is an opportunistic importer of Australian canola, with their own production generally meeting demand (ACIL Tasman and Farm Horizons 2003). Australia’s strong domestic GM food labelling requirements means current export market requirements will likely be met if GM crops are commercially released regardless of the variance in world consumer demands (Anderson and Jackson 2005, James and Burton 2003).
For Australia to continue marketing certified non-GM canola the canola industry would have to implement a system of segregating GM canola from non-GM canola in the supply chain. Cooperative Bulk Handling (CBH), who control handling, transport and storage of grain from grower delivery to export in Western Australia, believe that segregation is already a long-term issue irrespective of GM crops (Burton et al. 2002, Collis 2003). Also, as more consumers demand products differentiated by variety, quality and place or method of production the need for large scale segregation increases (Lin 2002, Wilson and Dahl 2005).
The Dept of Ag WA (2003)expect that the introduction of GM canola into Western Australia will have minimal impact on the canola industry in the current environment. They emphasised that to ensure that the impact on canola markets is minimal and to provide a flexible capacity to respond to changes in acceptance of GM canola by major export customers in the future, it will be important to segregate GM and non-GM canola.
For the purpose of this study the term ‘segregation’ refers to a ‘closed loop’ channel that facilitates the production and delivery of an assured quality by allowing identification of a commodity from the seed to the processed product on a retail shelf, as defined by Smyth and Phillips (2002). Segregation therefore involves keeping the segregated grain separate throughout handling, transport and storage in such a way that intermingling cannot occur.
Canada has segregated grain for niche markets such as GM canola, the British baker Warburtons’ wheat contract program, and the Canadian Wheat Board’s malting barley and AC Karma contracts (Bevilacqua 1999, Canadian Grains 1998, Smyth and Phillips 2002). Canadian estimates of canola segregation costs range from 6 to 41 per cent of the producer price for conventional canola (Europa 2003, Golder 2000). These cost estimates are possibly underestimated as they are based on small volumes, are not significant operations and also do not recognise the loss of the organic canola market in Canada (Smyth and Phillips 2002). Smyth & Phillips (2001) estimated the cost of segregating GM canola during handling in Canada in 1996 to be 3-6% of the farm gate price. The cost for segregation in the US, Brazil and the EU is estimated to be between 5 and 15 per cent of the farm gate price (Kingwell 2000). Segregation during handling of speciality corn in Illinois is estimated to be 6-8% of farm gate price and speciality soybeans 1-2% (Good and Bender 2001). More recently Sobolevsky et al (2005) relied on Lin et al’s (2000) estimate of soybeans segregation costing between 3.4% and 10.3% of the average farm price in their analysis of world soybean trade. Moschini et al (2005) reviewed these previous studies and assumed a 5% segregation cost for GM corn, cotton, soybeans and canola.
Australia must be wary of over-reacting to perceived market signals of high demand for non-GM canola as the costs of segregating canola may not be recovered from the market (Leading Dog Consulting and Peter Flottmann and Associates 2001). For the Australian canola industry to respond effectively to this uncertainty about the introduction of GM canola, the need for segregation and its economic consequences must be investigated.
The focus of this study is on the Great Southern Region of WA (Figure 1) where around 40 per cent of the total Western Australian canola crop is currently produced (CBH 2003). As is typical for Australian broad acre production, Great Southern canola growers deliver 90-100% of their production to the local grain handling and storage firm Cooperative Bulk Handling (CBH), immediately following harvest (CBH 2003). Canola is delivered by the grower or a transport contractor to the CBH receival point in their local shire or to the larger port facilities as depicted in Figure 2. Based on global estimates of segregation it is expected that the cost of segregating GM and non-GM canola in this region from farm-gate to Albany Port will approximate world estimates of between 5 and 15 per cent of the producer price.
Figure 1. Map of the Great Southern Region of Western Australia with shire boundaries and town localities.
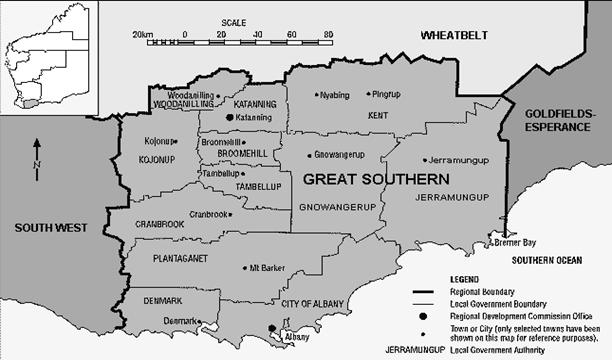 |
Source: DLGRD (2005).
Figure 2. Typical farm to port supply chain for canola in the Great Southern Region of Western Australia.
Methodology
Incremental costs associated with segregating GM and non-GM canola after the farm gate are calculated for three alternative systems using expected paths or long term values for certain key parameters (e.g. GM canola adoption levels, land allocation to canola and changes in canola delivery patterns). The three segregation systems were identified for this study based on historical receivals of canola by CBH and on discussions held with David Fienberg[1] into the likely management of GM canola receival by CBH following the commercial release of GM canola.
Segregation System One stipulated that Broomehill would be dedicated to receive GM canola only, and all other inland receival points would receive non-GM canola only. Albany Port was assumed to receive GM and non-GM canola with the canola being segregated at all stages. Segregation System One is a dedicated receival system, indicating the possible receival system if receival points were to receive and store GM or non-GM only. A shared receival system was devised for Segregation System Two whereby all receival points across the Great Southern Region took delivery of both GM and non-GM canola. Segregation System Three, the Albany based receival system, required that all GM canola be delivered to the Albany Port with all other receival points dedicated to receive non-GM canola only. It must also be noted that almost all export canola sold by producers will end up either directly or indirectly at Albany Port. Therefore, all designated non-GM canola would be tested directly before loading onto a ship.
A model was constructed to identify the total cost of handling, transport and storage post-farm gate to Albany Port for all canola in the Great Southern Region for the three segregated receival systems and for a ‘base’ option that entails no segregation at all. Any regular costs of handling, transport and storage that would be incurred in each of the segregation systems regardless of segregation were not included. Therefore the costs included in the analyses are related to segregation only. The net present value of the costs was calculated over a 10 year period to allow for a stable GM canola adoption level to be achieved and the full costs of the implementation and maintenance of the segregation system to be realised. All costs were initially identified on a per tonne basis and then extended for the entire Great Southern Region’s canola production. The costs identified for each receival segregation systems were based on the work of Buckwell, Brookes and Bradley (1999), Bullock, Desquilbet and Nitsi (2000), Fulton et al. (2001) and Stone et al. (2002).
Expected Canola Production and Receivals in the Great Southern Region
Given that GM canola has not been grown in Western Australia, expected GM canola production over the next 10 years in the Great Southern Region (GSR) was calculated based on expected maximum canola production and expected adoption of GM varieties. It was assumed that each grower who adopted GM canola could produce both GM and non-GM canola in the same season and segregate them prior to delivery. Of note, Smyth and Philips (Smyth and Phillips 2001) identified the on-farm cost of segregation to be CAN $1/ tonne due to inefficient use of storage, while ACIL Tasman and Farm Horizons (2003) estimated the cost of segregating canola due to cleaning, auditing and training requirements in Victoria to be AUD $5.13/ tonne or less than 2% of farm gate price. While the cost of on-farm segregation is important, the focus of this paper is on the post farm gate cost of the three delivery options described above and therefore it is assumed that growers are able to deliver non-GM canola within tolerance levels.
The production of GM and non-GM canola was calculated using data collected from a grower survey (see Crowe and Pluske (2005) for survey details) and from CBH (2003) and ABARE (2003). The hectares of canola produced in the GSR at any one time was assumed to be a function of the total number of grain growers in the GSR, the maximum percentage of growers who could plant canola given soil type, farm location and the like, the proportion of that maximum who would actually grow canola at any one time and the average hectares of canola per farm. The hectares of GM canola produced in the GSR at any one time would then be a function of the hectares of canola produced in the GSR at that time, the expected maximum percentage of canola growers who would plant GM canola, the proportion of that maximum who would actually grow GM canola at any one time, the maximum percentage of the total canola area that a farmer would allocate to GM canola on his/her farm and the proportion of this maximum that a producer would actually plant to GM canola at any one time.
The yield of GM canola in tonnes per ha was assumed to be the product of the tonnes per ha of non-GM canola and the percentage yield advantage GM canola offers over non-GM canola[2]. The quantity of GM canola produced in tonnes at any one time would then be the product of the number of hectares grown and yield. The quantity in tonnes of non-GM canola produced by all growers at any one time was derived by multiplying the yield of non-GM canola by the quantity produced. The total canola production of the GSR in tonnes at any one time could then be found.
Based on data provided by CBH (2003), averages taken over the years 1999, 2000, 2001 and 2002 indicate that there is variation between shires for both canola production and CBH receivals (Table 1). Therefore the model was developed to deal with different expected grower delivery behaviour.
Table 1. Shire canola production as a percentage of total production and expected CBH receivals as a percentage of total receivals in shires in the Great Southern Region (GSR).
Shire |
Production (% of GSR) |
Grain Receivals (% of GSR) |
Albany |
9 |
49 |
Cranbrook |
10 |
10 |
Gnowangerup |
13 |
9 |
Jerramungup |
16 |
9 |
Katanning |
8 |
8 |
BroomeHill |
5 |
7 |
Kojonup |
10 |
6 |
Kent |
6 |
2 |
Plantagenet |
13 |
0 |
Tambellup |
4 |
0 |
Woodanilling |
6 |
0 |
Knowing the region’s production of canola and using data from Table 1, a shire’s production (tonnes) of GM canola and non-GM canola at any one time could be calculated as the average percentage of production for that shire multiplied by the corresponding GM or non-GM canola production for the GSR.
Delivery options or pathways to receival points varied depending on grower delivery behaviour as defined through the grower survey mentioned above and the segregation system imposed upon the farmers for each shire. Therefore the proportion of both GM and non-GM canola grown in a shire and delivered either within the shire or to an external shire was identified. Receivals of GM canola and non-GM canola in a specific shire at any one time could then be calculated as the sum of the proportion of canola taking a specific option or pathway from ‘delivery shire’ to ‘receival shire’ for every pathway taken, multiplied by production in the ‘delivery shire’ (either GM or non-GM canola depending on its GM status). Total receivals at each time period by CBH for the GSR in tonnes of GM and non-GM canola is calculated as the sum of the receivals in each shire of GM and non-GM canola respectively.
Costs Incurred
Contamination of non-GM products by GM seed post farm gate is most likely to occur due to physical seed movement, especially if GM and non-GM canola share a supply chain (AOF 2003a). Therefore costs of the segregation system tend to focus around this issue.
The cost ($/tonne) of cleaning trucks/trains post GM-canola transport at each time period is the product of the cost of labour in $/hr and the time involved in hours to clean one truck, divided by the average capacity of a truck in tonnes multiplied by the total tonnes of GM canola received in the GSR (as estimated above). The opportunity costs associated with the inconvenience of cleaning, primarily lost efficiency, is acknowledged as important but due to lack of information is made equivalent to this cost.
The cost of testing all non-GM canola received at each time period is incurred by all three segregation options and includes a factor that accounts for the cost of learning about the new testing equipment and procedures and for each truck load of canola, the cost of equipment for each test, the cost of labour in $/hr and the time involved in hours for each test, divided by the average capacity (tonnes) of a truck, multiplied by total non-GM canola received in the Great Southern (as found above). For simplicity, the opportunity cost of the test is equal to the cost of the test and represents any inconvenience and inefficiency caused by the testing. The opportunity cost of lost storage capacity at each time period is calculated as the product of the lost capacity of the storage facilities in tonnes, the capital value of the storage in $/tonne and the number of delivery sites affected.
The shared system incurs additional costs due to increased cleaning and management requirements. The cost of cleaning equipment and storage facilities and the cost of management time are calculated as the product of the cost of labour in $/hr, the time involved for cleaning and management in hours and the quantity of GM canola received by CBH. A factor is also included in the equation and indicates the increased time taken to teach and learn the new cleaning equipment and procedures when initially introduced. There is also recognition that management would receive a higher wage proportional to the wage of the lower wage casual employees and so is greater than one. The opportunity cost associated with the loss of efficiency, because resources are reallocated, is simply made equal to the actual costs.
If contamination has occurred during storage at the receival point it must be identified before transportation to port. This means that with the shared segregation system non-GM canola is required to be tested again prior to transport to port. These costs are calculated similarly to those mentioned above.
The consequence of contamination occurring at the receival point with the shared segregation system is a loss of premium for the proportion of non-GM canola affected by contamination. The loss of premium is calculated as the product of the probability of contamination occurring as a percentage, the tonnes of non-GM canola received in the GSR and the premium available for non-GM canola in $/tonnes.
Due to differences in grower delivery behaviour and the segregation system imposed upon the farmers, there is an additional cost due to indirect delivery of GM canola and/or non-GM canola. Based on the delivery of GM and non-GM canola in each shire, the additional cost of delivery for farmers in the GSR would be a factor of the grain delivered through each pathway and the associated cost. This associated cost is assumed to be the increase in cost from ‘normal’ delivery to imposed delivery. Whilst some of this cost is due to direct delivery costs, the rest is due to an opportunity cost the growers incur due to inconvenience and lost efficiency in their program. The latter cost may be overestimated for some producers as, for simplicity, it is based on freight costs. Therefore a factor is included in the equation to recognize that growers are inconvenienced but not required to pay twice for delivery.
The total cost in any one year for a specific segregation system will therefore be the sum of the costs identified above. The net present value (NPV) of each segregation systems over a period of time is a factor of the total costs of the system and a discount rate.
Application
Data gathered from a survey of canola growers in the Great Southern Region of Western Australian (Crowe and Pluske 2005) was combined with that from CBH (2003), the Elders Farm Weekly (2003), Australian Bureau of Agricultural and Resource Economics (2003) and the Australian Oilseeds Federation (2003a, 2003b) and used in the model to find the NPV for each segregation system.
Results and Discussion
The total cost of handling, transport and storage for all GM and non-GM canola post-farm gate to Albany Port without segregation for the 10 year study period was found to be $59.9 million. The cost effectiveness analysis of a GM canola segregated receival system indicates that the additional costs due in Segregation System 1 would be $2.9 million, Segregation System 2 $5.5 million and Segregation System 3 $2.7 million. This equates to a long run cost increase of $1.87/ tonne of canola for Segregation System 1, $3.40/ tonne for Segregation System 2 and $1.87/ tonne for Segregation System 3 (Table 2). Segregation System 1 is marginally more expensive than Segregation System 3 due to the increased costs of receiving and storing GM canola segregation at two receival points outweighing the cost savings of more convenient transport (Table 2). Segregation System 1 inconveniences growers less than Segregation System 3 and is less disruptive for the supply chain than Segregation System 2. The costs to the supply chain of Segregation System 2 are high due to the sampling and storage of both GM and non-GM at all receival points and prior to transport to the port, not being compensated by the reduction in transport costs to growers by the added convenience. While Segregation System 2 would inconvenience growers less, it would disturb the supply chain more as indicated by the costs. Segregation System 3 carries greater opportunity costs associated with indirect delivery for growers, however the costs borne by the supply chain are minimal.
Table 2 The long run cost of segregation measures along the farm to port supply chain of each project ($/ tonne).
Segregation System |
||||||
Dedicated |
Shared |
Albany |
||||
GM |
Non-GM |
GM |
Non-GM |
GM |
Non-GM |
|
Transport to nearest receival point |
0.45 |
0.00 |
0.45 |
0.00 |
0.45 |
0.00 |
Sampling & storage at receival point |
0.52 |
1.08 |
3.80 |
1.08 |
0.26 |
1.08 |
Sampling prior to transport to Albany port |
- |
- |
0.00 |
0.55 |
- |
- |
Transport to Albany port |
1.27 |
0.00 |
0.10 |
0.00 |
1.56 |
0.00 |
Sampling at Albany port |
0.00 |
0.10 |
0.00 |
0.09 |
0.00 |
0.10 |
Total |
2.24 |
1.18 |
4.35 |
1.72 |
2.27 |
1.18 |
Sensitivity analysis (Table 3) indicated the three segregation systems are sensitive to changes in the number of growers planting canola and the area of canola they plant. Segregation Systems 1 and 3 are also sensitive to changes in the factor included in the analyses to account for the overestimation of grower inconvenience due to altered delivery. Segregation System 2 is sensitive to changes in the price premium available for non-GM canola while Segregation Systems 1 and 3 are not influenced by the non-GM canola premium as it is assumed the systems prevent any contamination of non-GM canola. While the models are quite sensitive to changes in some variables, the sensitivity analysis indicates that the ranking of the three scenarios is robust overall.
Table 3 The NPV ($million) of each project when variables are altered in a sensitivity analysis
Segregation System |
|||
Dedicated |
Shared |
Albany |
|
Standard analysis |
2.9 |
5.5 |
2.7 |
Number of canola growers increased from 45% to 60% |
3.6 |
6.5 |
3.5 |
Area planted decreased from 300ha to 200ha |
2.1 |
4.4 |
1.9 |
Area planted increased from 300ha to 400ha |
3.6 |
6.5 |
3.5 |
Grower inconvenience parameter reduced from 0.33 to 0 |
2.1 |
5.5 |
1.7 |
Grower inconvenience parameter increased from 0.33 to 1 |
4.8 |
5.5 |
5.2 |
Price premium increased from $0/t to $10/t |
2.9 |
6.6 |
2.7 |
Price premium increased from $0/t to $20/t |
2.9 |
7.8 |
2.7 |
Conclusion
The increase in the cost of transport, handling and storage due to segregating GM and non-GM canola in the Great Southern Region of WA from farm-gate to Albany Port was found to be between 5 to 9 per cent of total grain handling cost. Hence the results found by this study are consistent with the literature and in particular with Golder (2000) who stated that the cost of segregating GM canola post farm gate to port in Canada increases farm-gate costs by 10 to 11 per cent. The lower cost of segregation by the dedicated and Albany receival systems, only a 5 per cent increase, may be due to underestimation of the inconvenience to growers by altered delivery, as demonstrated by the sensitivity analysis. This slight difference may also be due to the differences between the Australian and Canadian supply chain, the Canadian receival system places more emphasis on on-farm storage and has a wider variety of transport methods.
If the canola industry is to implement GM canola segregation following the commercial release of GM canola the Albany scenario is recommended based on cost. The Albany scenario would be most attractive to the supply chain from a cost perspective, but growers may initially feel the cost of the inconvenience they bear is not fully realised. If a shared system is introduced however, the increased costs to the post-grower supply chain will be borne by the entire supply chain and as such the grower will pay directly for segregation, rather than indirectly through inconvenience.
The main limitations of this study focus on the information available from the supply chain and the assumptions underlying the cost effectiveness model. Farmers, trucking contractors and CBH are businesses and as such certain information is commercially sensitive and was unavailable for this study. The model assumes growers can deliver non-GM canola of the required tolerance level. This may not be possible in light of work completed by the University of New England regarding volunteer canola and cross contamination in Tasmania (UNE 2003). The model also assumes all non-GM canola is delivered as non-GM canola, rather than allowing for the possibility of some being delivered as GM canola as would be possible.
Furthermore, research into the concept of grower inconvenience and its importance to decision making would be beneficial for improving this study. By identifying how the supply chain, consumers or policy makers quantify grower inconvenience, this study could more accurately measure this opportunity cost. Also, this study could be further utilised by being built upon or redeveloped for other regions of Australia, to incorporate the entire Western Australian canola production region or investigate other crops requiring segregation.
References
ABARE. (2003). Australian Commodity Statistics. Australian Bureau of Agricultural and Resource Economics, Canberra.
ABARE. (2005). Australian Commodity Statistics. Australian Bureau of Agricultural and Resource Economics, Canberra.
ACIL Tasman and Farm Horizons. (2003). Genetically modified canola, market issues, industry preparedness and capacity for segregation in Victoria. A report for the Victorian Government's Interdepartmental Canola Steering Committee, Canberra.
Anderson, K. and Jackson, L. A. (2005). GM crop technology and trade restraints: economic implications for Australia and New Zealand, The Australian Journal of Agricultural and Resource Economics 49, 263-281.
AOF. (2003a). Fast Facts No 1: Adventitious presence in canola. Australian Oilseed Federation, Australia.
AOF. (2003b). Fast Facts No 2: Market implications with GM canola. Australian Oilseed Federation, Australia.
Bevilacqua, R. (1999). The grain supply chain: Issues related to identity preservation, Proceedings of the Economics of Quality Control in Agriculture Conference; Saskatoon. Canadian Grains Commission.
Buckwell, A., Brookes, G. and Bradley, D. (1999). Economics of identity preservation for genetically modified crops. Food Biotechnology Communications Initiative, Europe.
Bullock, D. S., Desquilbet, M. and Nitsi, E. I. (2000). The economics of non-GMO segregation and identity preservation. Dept of Agriculture and Consumer Economics, University of Illinois, USA.
Burton, M., James, S., Lindner, R. K. and Pluske, J. (2002). A way forward for Frankenstien foods, in Santaniello, V., Evenson, R. E. and Zilberman, D. (eds.), Market Development for Genetically Modified Foods. CAB International, London.
Canadian Grains. (1998). Identity preservation systems in the Canadian grain industry: A discussion paper. Canadian Grains Commission, Canada.
CBH. (2003). Production and receival data. Cooperative Bulk Handling, Perth.
Collis, A. (2003). Playing the identity card, Feeding tomorrow's world: Biotechnology and the grain industry. Grains Research and Development Corporation, Canberra.
Crowe, B. and Pluske, J. (2005). Will genetically modified canola be adopted in Western Australia, Working Paper. The University of Western Australia, Perth.
DAWA. (2003). Assessment of the international market for genetically modified canola. Department of Agriculture, Government of Western Australia, Perth.
DLGRD. (2005). Regional Maps. Dept of Local Government and Regional Development, Government of Western Australia. Available from http://www.dlgrd.wa.gov.au/statisticInfo/regionMaps.asp [accessed 20 July 2006].
Elders Farm Weekly. (2003). Farm Budget Guide 2003. Elders Farm Weekly and Dept of Agriculture, Government of Western Australia, Perth.
Europa. (2003). Economic impacts of genetically modified crops in the agri-food sector: A synthesis, in Directorate-General for Agriculture (eds.), Working Document. Europa, Brussels.
Fulton, M., Furtan, H., Gosnell, D., Gray, R., Hobbs, J., Holzman, J., Kerr, B., McNaughten, J., Stevens, J. and Stovin, D. (2001). Transforming Agriculture: The Benefits and Costs of Genetically Modified Crops. A report for the Canadian Biotechnology Advisory Committee Project Steering Committee on the Regulation of Genetically Modified Foods, Ottawa.
Golder, G. (2000). Economic impact study: Potential costs of mandatory labelling of food products derived from biotechnology in Canada. KPMG Consulting, Ottawa, Canada.
Good, D. and Bender, K. (2001). Marketing Practices of Illinois Specialty Corn and Soybean Handlers. A report for the University of Illinois, Urbana.
James, S. and Burton, M. (2003). Consumer preferences for GM food and other attributes of the food system, Australian Journal of Agricultural and Resource Economics 47, 501-518.
Kingwell, R. (2000). GM crops: Trends and policy issues of relevance to Western Australia: A discussion paper. Department of Agriculture, Government of Western Australia, Perth.
Leading Dog Consulting and Peter Flottmann and Associates. (2001). Segregating gene technology products: Requirements, costs and benefits of identity preservation, segregation and certification. A report for the Agriculture, Fisheries and Forestry Australia, Commonwealth Goverment of Australia, Canberra.
Lin, W. (2002). Estimating the costs of segregation for non-biotech maize and soybeans, in Santaniello, W., Evenson, R. E. and Zilberman, D. (eds.), Market development for genetically modified foods. CAB International, Wallingford, UK.
Lin, W., Champers, W. and Harwood, J. (2000). Biotechnology: U.S. Grain Handlers Look Ahead, Agricultural Outlook. U.S. Department of Agriculture, Washington DC.
Moschini, G., Bulut, H. and Cembalo, L. (2005). On the segregation of genetically modified, conventional and organic products in European agriculture: A multi-market equilibrium analysis, Journal of Agricultural Economics 56, 347-372.
OGTR. (2003a). GMO Record. Office of the Gene Technology Regulator, Canberra.
OGTR. (2003b). Media Release: Joint regulatory decision on Monsanto GM canola. Office of the Gene Technology Regulator, Canberra.
OGTR. (2003c). Risk assessment and risk management plan DIR-21/2002: Commercial release of genetically modified (InVigor(R) hybrid) canola. Office of the Gene Technology Regulator, Canberra.
Smyth, S. and Phillips, P. (2002). The battle between GM canola and public, private and collective interests: Defining and documenting the costs and benefits of identity preservation, segregation and traceability, Proceedings of the International Consortium on Agricultural Biotechnology Research Meeting; Ravello, Italy. ICABR.
Smyth, S. and Phillips, P. W. B. (2001). Competitors co-operating: establishing a supply chain to manage genetically modified canola, International Food and Agribusiness Management Review 4, 51-66.
Sobolevsky, A., Moschini, G. and Lapan, H. (2005). Genetically modified crops and product differentiation: Trade and welfare effects in the soybean complex, American Journal of Agricultural Economics 87, 621-644.
Stone, S., Matysek, A. and Dolling, A. (2002). Modelling possible impacts of GM crops on Australian trade. A report for the Productivity Commission, Canberra.
UNE. (2003). GM canola 'difficult to contain'. University of New England, Armidale, Australia.
Wilson, W. W. and Dahl, B. L. (2005). Costs and risks of testing and segregating genetically modified wheat, Review of Agricultural Economics 27, 212-228.
Acknowledgments
The authors would like to thank the Albany Port Authority and Cooperative Bulk Handling for assistance with this project.