Australasian Agribusiness Review - Vol.15 - 2007
Paper 4
ISSN 1442-6951
An Economic Evaluation of the Ricecheck Extension Program in NSW
Rajinder P. Singh1, John P. Brennan2 and John Lacy1
1 NSW Department of Primary Industries, Yanco, NSW
2 NSW Department of Primary Industries, Wagga Wagga, NSW
Correspondence Address: Dr Rajinder P Singh, Research Economist,, Department of Primary Industries, YAI, Yanco, NSW. Tel: 02 69 512 618. Fax: 02 69 557 580. Email: Rajinder.pal.singh@dpi.nsw.gov.auAbstract
Ricecheck, an extension program for rice developed by the NSW Department of Primary Industries, is based on eight best management practice recommendations (“key checks”) considered essential for achieving high yields. The program comprises grower meetings, monitoring crops, keeping crop production records and field days. The Ricecheck recommendations provide information on the impact of the best management practices on crop yields and farm profitability. In this paper, the economic benefits from Ricecheck to the rice farmers are measured. An economic evaluation indicates that there has been a high economic return on the funds invested in developing and adopting Ricecheck.
Key words: Rice, extension, key checks, yield, economics
1. Introduction
In the 1980s, increasing input costs and low yields placed pressure on rice farmers, farm advisors and researchers to find ways to improve yields to enable farmers to remain viable. To assist with identifying the causes for the limited yield increases on farms, and to develop a package of best management practices for rice, a field study of commercial rice crops was conducted in 1985-86 in the Finley-Jerilderie area of NSW. The study observed that only a few growers were able to achieve a consistently high yield. In addition, there was generally a considerable gap between the yields achieved by the highest-yielding and lowest-yielding rice crops, even within different irrigated areas.
The study also observed that the widely used transfer of technology model (Lacy 1998), whereby research findings are transferred to farmers in a one-directional manner, was too slow in the dispersal and adoption of a new technology and in creating change. There was a need for a fresh integrated approach that would also help to promote best management practices, to identify and address issues important for improving yield, financial viability of the rice farms and development of the rice industry.
To address these issues, a new approach to rice extension advice called “Ricecheck” was developed in 1985 initially for rice growers in the Finley district, involving farmer participation and using shared knowledge between farmers and researchers to identify the key determinants of higher-yielding rice crops. Since that time, Ricecheck has been widely adopted across the whole NSW rice industry and has continued to be a significant feature of rice farming.
The aim in this paper is to report on an economic evaluation of the impact of the Ricecheck program since its inception, and to undertake a benefit-cost analysis of the resources invested in the Ricecheck program since 1985. The focus of this evaluation was on the economic effects of the adoption of best management practices recommended by the Ricecheck program which result in productivity gains at the farm level. There are also significant environmental and social impacts associated with the Ricecheck program (see Singh et al. 2005), but in this paper we have not attempted to place an economic value on them.
2. The Ricecheck program
2.1 Key check recommendations
The basis of the Ricecheck program is that crop management of the highest-yielding crops is examined, to identify the key determinants of those higher yields. The major highlight from the results of the initial analysis of different factors responsible for increasing rice yields was that there was no single factor which consistently produced high yields. Increased yields only arise by ensuring that all the key factors (“key checks”) are carried out correctly. From the participation of farmers and the development of shared knowledge through group activities, with extension officers playing a pivotal role, the key factors linked to yield were identified from observation of the farmer paddocks. Once those key checks were identified, they were used as the basis for the advisory program to produce high-yielding rice crops. The key check recommendations are, as far as possible, simple and objective, providing numbers that can be measured and compared. Farmers and rice extension and research staff work together modify the recommendations on these checks each year as necessary.
Initially the key checks focussed only on yield. Since environmental and grain quality issues have become very important and are intertwined with yield, four extra checks relating to these issues have been added in recent years. However, the data available over the period since 1985 relate to 8 key checks. Therefore in this analysis we have focussed on the 8 key checks that have been in wide use over that period (Table 1). A more detailed description of the criteria for meeting each of these checks
Table 1: Eight Key Checks included in Ricecheck Analysis
Key Checks |
1. Field layout |
2. Sowing time |
3. Crop establishment |
4. Crop protection |
5. Pre-flood nitrogen |
6. Panicle Initiation nitrogen |
7. Panicle Initiation date |
8. Water management |
Analysis of the yield response to implementing the Ricecheck program has shown that the more checks adopted, the higher the yield is likely to be. Further, if all the key checks are achieved, a farmer would be able to achieve high yields relative to potential yields.
2.2 Activities within Ricecheck
In aiming to assist farmers to achieve the key checks, extension and research staff in the Ricecheck program uses a wide range of learning methods to help to improve understanding of rice growing systems and constraints. A critical element of the operation of Ricecheck is the use of small discussion groups where farmers can both learn and give feedback on the Ricecheck management package. In the discussion groups, the farmers are encouraged to participate in the program through a number of learning steps – observing, measuring, recording, interpreting and acting. Regular group meetings are held at critical times before and during the cropping season. This has led to improvements in farmers’ knowledge, learning and management skills. This also allows them to influence changes to the Ricecheck management package and the key checks and to develop “ownership” of the program.
The momentum for the success of Ricecheck and the discussion groups has come from having a focus on the key checks linked to yield. Through the exchange of experiences within the groups, farmers are assisted and encouraged to meet the key checks.
2.3 Adoption of Ricecheck
In 2004, approximately 40 Ricecheck discussion groups were being run by seven District Agronomists working in the entire NSW rice belt, and there were about 780 farmers who at some time attended these discussion groups during 2004 (Singh et al. 2005). Since the membership of discussion groups is voluntary, it can vary by up to 50 percent, depending upon the clash of farmers’ time with other activities in a particular year. Many of these groups have been operating for 18 years and continue to function productively.
The number of crops and checks achieved in the Ricecheck system each year since 1986 is shown in Table 2 (data on a regional basis are available in Singh et al. 2005). From an initial level of 30 crops in 1986, the number of crops grown by farmers using the Ricecheck system grew rapidly to reach 746 in 1995. Since that time, the number of crops using Ricecheck has fluctuated due to a number of factors affecting the total area under rice, including drought, the timing of the announcement and level of water allocations, prices of rice, prices of other crops relative to rice and occasional gaps in departmental staff servicing the delivery of Ricecheck.
Table 2: Number of Crops Achieving Key Checks, 1986 to 2002
Number of key checks achieved |
|||||||||||
0 |
1 |
2 |
3 |
4 |
5 |
6 |
7 |
8 |
Total |
Average |
|
1986 |
1 |
2 |
4 |
5 |
7 |
6 |
3 |
1 |
0 |
30 |
3.8 |
1987 |
1 |
3 |
9 |
11 |
13 |
8 |
5 |
2 |
0 |
53 |
3.7 |
1988 |
2 |
6 |
17 |
22 |
25 |
17 |
10 |
4 |
0 |
105 |
3.7 |
1989 |
3 |
11 |
29 |
39 |
42 |
28 |
17 |
7 |
1 |
178 |
3.7 |
1990 |
5 |
16 |
42 |
55 |
59 |
38 |
24 |
10 |
1 |
251 |
3.7 |
1991 |
6 |
21 |
51 |
69 |
76 |
50 |
32 |
14 |
2 |
319 |
3.7 |
1992 |
7 |
25 |
60 |
82 |
93 |
61 |
39 |
17 |
2 |
387 |
3.7 |
1993 |
8 |
31 |
73 |
99 |
112 |
74 |
48 |
20 |
3 |
466 |
3.7 |
1994 |
9 |
36 |
85 |
116 |
131 |
86 |
56 |
24 |
3 |
546 |
3.7 |
1995 |
2 |
10 |
50 |
98 |
188 |
164 |
163 |
61 |
10 |
746 |
4.6 |
1996 |
2 |
12 |
58 |
120 |
150 |
167 |
102 |
39 |
9 |
659 |
4.4 |
1997 |
0 |
22 |
61 |
125 |
156 |
149 |
100 |
23 |
0 |
636 |
4.2 |
1998 |
0 |
1 |
13 |
55 |
122 |
163 |
145 |
63 |
11 |
573 |
5.1 |
1999 |
0 |
4 |
25 |
69 |
154 |
166 |
129 |
49 |
7 |
603 |
4.8 |
2000 |
2 |
8 |
49 |
129 |
163 |
199 |
128 |
42 |
9 |
729 |
4.5 |
2001 |
0 |
6 |
19 |
87 |
188 |
254 |
174 |
82 |
13 |
823 |
4.9 |
2002 |
0 |
4 |
61 |
85 |
175 |
147 |
71 |
23 |
5 |
571 |
4.3 |
Even with good management and knowledge, the checks proved difficult to achieve; for example in 2002, 65 (11 percent) out of 571 crops could only achieve 1 or 2 checks, and only 5 (0.9 percent) achieved all 8 checks (Table 2). On average, the number of checks achieved for crops in Ricecheck between 1986 and 2002 was 4.1 checks, or 52 percent of the 8 known checks.
Even growers who are consistent members of the Ricecheck discussion groups do not find it a simple task to achieve particular checks for their crops in some years. There are a number of reasons why the key checks are not achieved in particular crops each year. They include the strict definition of some adoption criteria, the timing of water allocations, links between some checks and the relative importance of a check in a particular year (see Singh et al. 2005 for more details).
Since 1986, many farmers are regular members of these discussion groups and are taking full benefit from the program. There are some others who join a group but leave after a few years. Although this helps them to improve their skills and knowledge about the significance of different key check recommendations in achieving higher yields, the Ricecheck program continually updates the regular members of the discussion groups about changes in key checks and other technologies over time. Irregular members or those who have never joined any discussion group may not be able to take advantage of such improvements in the key check recommendations and other technologies, which may result in them achieving lower yields than the regular attendees.
The Ricecheck program annually publishes a booklet of the Ricecheck recommendations (Lacy et al. 2004) and a copy is sent to each rice grower every year. Some growers follow those recommendations without necessarily becoming part of a Ricecheck discussion group or recording the detailed information for their crops. Further, District Agronomists also promote the recommendations of the Ricecheck program during one to one and preseason meetings with farmers, through the media and field days. There are benefits to those who partially adopt this program or follow the recommendations based on the information given in the book, which also need to be considered to measure the full impact of the program.
2.4 Value of Ricecheck to growers
When growers adopt Ricecheck, for each check achieved the expected level of yield increases. Although there can be seasonal differences, and differences between regions, the accumulated data from the Ricecheck database provides a measure of the average benefits to growers (in terms of yield increases) from the adoption of the different numbers of checks.
The Ricecheck database contains the yields obtained from each crop and the number of checks achieved for that crop. Analysis of the database revealed that farmers not achieving any checks had average yields of 8.70 t/ha from the variety Amaroo, while those who were able to achieve one check obtained 8.88 t/ha. The yield increased progressively as further checks were achieved, by an average of 1.75 t/ha for each additional check. If all eight checks were achieved, farmers obtained average yields of 10.10 t/ha for Amaroo.
Table 3: Expected Yields from Achieving Different Number of Checks
Number of checks |
Estimated yield (t/ha) |
Benefitsa of checks (t/ha) |
Marginal benefitsb of checks (t/ha) |
0 |
8.70 |
0.00 |
0.000 |
1 |
8.88 |
0.18 |
0.175 |
2 |
9.05 |
0.35 |
0.175 |
3 |
9.23 |
0.53 |
0.175 |
4 |
9.40 |
0.70 |
0.175 |
5 |
9.58 |
0.88 |
0.175 |
6 |
9.75 |
1.05 |
0.175 |
7 |
9.93 |
1.23 |
0.175 |
8 |
10.10 |
1.40 |
0.175 |
However, during the period of the analysis, potential rice yields have increased for a number of reasons other than the Ricecheck program, including the use of higher-yielding varieties. The analysis undertaken for this paper does not imply that yield levels have not increased from other sources, but merely assumes that the benefit from adopting additional checks has remained constant throughout the period.
The approach of considering the total number of checks achieved as the key indicator, rather than the achievement of particular individual checks, implies that each of the checks is equally important in determining yield levels. While this could be challenged, the limited resources available for this study and the nature of the data in the database precluded any analysis of the value of achieving individual checks without substantial analytical resources beyond the scope of this study. Therefore, in the analysis presented here, the implicit assumption is that each of the checks has equal weight, and any combinations of the same number of checks would give the same expected yield level.
2.5 Costs of adopting Ricecheck
In adopting Ricecheck, farmers have to make several commitments of their time and resources. The input of farmers’ time was estimated at 8.7 hours per crop, comprising of time spent at group meetings, field days related to Ricecheck, crop monitoring activities and formal record-keeping (Singh et al. 2005). Farmers who adopted Ricecheck informally, without keeping formal records, were assumed to also spend time at meetings and field days and the same time on crop monitoring, but not the time on record-keeping. Those who were defined as “awareness adopters” were estimated to spend time gaining awareness only. The farmers’ time was valued at a basic rate of $25 per hour, and was valued at $218, $143 and $75 per crop for full adopters, informal adopters and awareness adopters, respectively (see Singh et al. 2005 for more details).
In addition, the adoption of some key checks involved extra expenditure on inputs. The additional costs of achieving the different checks are estimated following discussions with rice industry research and extension officers for an average rice crop of 30 hectares (more details are given in Singh et al. 2005). Some of the checks require adjustments to timing of operations, and have no direct additional costs. Others, where plant densities are required, need increased seeding rates for most farmers. Similarly, where tissue testing for nitrogen is undertaken, the costs of the testing are included. Other costs involve structural changes to farm layout, such as laser levelling and bank height, both of which are estimated to provide benefits for 20 years. In those cases, the annual costs for rice are converted to a per hectare basis. Where the benefits from laser levelling are shared between different crops, an estimate of the proportion of value to rice is included. As the adoption of the checks leads to increased yields, the harvesting costs for the additional yield are also included. On this basis, the total cost of adopting all eight checks is estimated as $40.14 per hectare, or an average of $5.02 per check. In the analysis, for each check achieved, costs of $5.02 per hectare are deducted from the gross benefits of adoption.
3. Economic assessment of the Ricecheck program
3.1 Methodology for evaluation
In evaluating an extension program, it can be particularly difficult to identify separately the benefits from research and extension activities involved. In a situation where the extension program is aimed at delivering research findings to farmers, a common approach is to evaluate the extension program as speeding up the rate of adoption of the technology.
Ricecheck has been in part a research process as well as an extension program. The participatory nature of Ricecheck has meant that the best management practices in the highest-yielding farmer crops were identified in collaboration with farmers rather than solely being based on researcher trials. These best management practices (“key checks”) were specified to enable farmers to benchmark their own practices against best management. Therefore, we have used a more complex approach in this evaluation. We have identified the benefits of adopting the key checks of the Ricecheck program, as well as estimating the progress that would have occurred without the Ricecheck program. Because of the farmer involvement, the cost of farmers’ labour is a significant element in the adoption of Ricecheck, and these costs are included as adoption costs in this analysis.
To evaluate returns to the investment on the Ricecheck program, we first measure the crop level benefits and costs from the adoption of the Ricecheck recommendations, and then draw those impacts into a benefit-cost framework to measure the returns to the research, development and extension investments on the program. While Ricecheck is essentially an extension program, we have also included the time spent by staff in developing and improving the program over many years.
The crop level benefits are estimated for the different levels of adoption of Ricecheck, and the total benefits are determined from the rate and extent of adoption of the program over the period of the analysis. The study measures the returns to the investment in research, development and extension, taking into account both in-kind and cash expenditure on the program.
3.2 Defining the “without Ricecheck” scenario
Although the concept of “checks” would not have existed without the Ricecheck program, most of the activities now defined as a “check” would have been incorporated into rice production over the years in the absence of Ricecheck (Singh et al. 2005). For example, the nitrogen NIR test would have been developed without Ricecheck, so farmers would have been assessing their crops for nitrogen status in mid-season by the late 1990s even without Ricecheck.
Therefore, following consultation with rice industry extension specialists, the ‘without Ricecheck’ baseline defined in terms of the number of checks the industry was likely to achieve was determined for different 5-year periods since 1986. This represents the equivalent level of learning about best management practice that would have occurred without Ricecheck. Therefore, Ricecheck only provided benefits where farmers achieved a higher number of checks than this baseline.
Notice that the number of checks in the baseline ‘without Ricecheck’ scenario steadily increased reflecting the fact that the industry outside Ricecheck eventually learnt ways to grow better rice crops from other sources, including the increasing number of private agronomists operating in the rice industry. Ricecheck did speed up the adoption of efficient technologies but this benefit erodes as the rest of the industry catches up over time.
In determining the baseline without Ricecheck, it was apparent that knowledge of the relevant checks was not sufficient to ensure that those checks would be achieved. Farmers using Ricecheck would have been aware of all the checks from their initial introduction to Ricecheck, but many failed each year to achieve the desired number of checks. From Table 2, the overall average number of checks achieved for crops in Ricecheck was 4.1 checks, or 52 percent of the 8 known checks. On that basis, it would seem that, at best, growers without Ricecheck would have been only able to achieve 52 percent of the baseline checks. However, given the extension support provided within the Ricecheck program, it was assumed that, rather than achieving the same level of the performance of those in Ricecheck, growers without Ricecheck support achieved only 80 percent of the level achieved. Thus, without Ricecheck the growers were assumed to achieve 41 percent (i.e., 80 percent of 52 percent) of the known checks in any season. Thus (Table 4), where growers would have known of 5 checks, we assume that they would have achieved 41 percent of 5 checks that is 2.1 checks, without Ricecheck. The number of checks achieved in a crop, rounded to the nearest integer, was used in the analysis (Table 4). The yield level associated with that number of checks was taken as the yield without Ricecheck, and benefits of Ricecheck are only available where yields achieved are higher than the appropriate baseline level.
Table 4: Number of Key Checks Achieved without Ricecheck
Period |
No. of checks known |
% known checks achieved |
Checks achieved |
Rounded level of checks |
Expected yielda (t/ha) |
1986 to 1990 |
1 |
41% |
0.4 |
0 |
8.70 |
1991 to 1995 |
3 |
41% |
1.2 |
1 |
8.88 |
1996 to 2000 |
5 |
41% |
2.1 |
2 |
9.05 |
2001 to 2002 |
7 |
41% |
2.9 |
3 |
9.23 |
a Yields based on smoothed yield data in Table 3
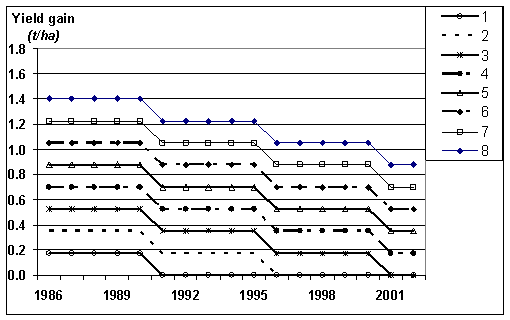
Yields in both the with-Ricecheck and without-Ricecheck scenarios depend on the number of checks achieved. Where no more checks are achieved than for the ‘without Ricecheck’ baseline in a particular year, there are no benefits from Ricecheck because the yield for both crops is the same. The benefits from achieving the different number of checks in the different periods, with the different baseline without-Ricecheck yields, are illustrated in Figure 1.
Figure 1: Yield Benefits of Achieving Different Numbers of Key Checks, by Year
3.3 Degree of adoption of Ricecheck
A range of different approaches have been followed to provide information to farmers to grow rice based on the recommendations of the Ricecheck program. As a result, the benefits of the Ricecheck recommendations to individual farmers varied depending upon their involvement and access to the different approaches (see Singh et al. 2005 for more details). In this study, the beneficiaries have been divided into four different categories depending upon the level of adoption of the Ricecheck program:
(a) Full adopters: This group of farmers are full participants of the Ricecheck program. As members, they keep records, monitor crops and always grow rice following Ricecheck recommendations, regularly attend group meetings, other farmers meetings, field days and read the Ricecheck booklet. This group is assumed to receive 100 percent of the unit benefits of Ricecheck.
(b) Informal adopters: The group of farmers who are not full participants but have developed their skills and knowledge and are aware of the importance of adoption of the Ricecheck recommendations for achieving higher yields. These farmers attend meetings and field days and grow rice following Ricecheck recommendations by reading the booklet and joining discussions with farmers who are regular members of the group. This group includes former members who no longer provide records of their crops, and other farmers who have never been formal members of Ricecheck. In this analysis, it is assumed that this group of farmers receive about 50 percent of the unit benefits of Ricecheck, given the level of information that they are known to receive.
(c) Partial adopters (awareness group): A group of farmers who have never joined any Ricecheck farmer discussion group but who either regularly attend other farmer meetings and field days organised by the district advisory staff of the NSW DPI or who try to follow the recommendations given in the Ricecheck booklet[1]. Based on estimates from advisory staff involved in the Ricecheck program, it is assumed that this group receives 20 percent of the unit benefits of Ricecheck.
(d) Non adopters: Even though all rice growers would be aware of the Ricecheck program, some growers are unable or unwilling to adopt Ricecheck recommendations because of a lack of skills, knowledge, resources, poor infrastructure, the location of the farm and social factors. This group is assumed to not receive any benefits from the program.
These assumptions are summarised in Table 5.
Table 5: Assumptions Relating to Adoption and Non-Adoption
% of known checks achieved |
% of benefits of checks achieved |
|
Full adopters |
52% |
100%a |
Informal adopters |
52% |
50%a |
Awareness adopters |
52% |
20%a |
Non-adopters |
0% |
0%a |
a Measured as proportion of benefits additional to those without Ricecheck
In estimating the number of rice crops that fall in each category, the following assumptions are made, on the basis of the experience of advisory officers of the NSW DPI:
- “Full” adopters: The analysis of the Ricecheck database revealed that the number of farmers in this group has reached a maximum of 17 percent of farmers in 2000, with an average of 10 percent over the period 1986 to 2002.
- “Informal” adopters are estimated to be twice the size of the group of full adopters[2].
- “Awareness” adopters are also estimated to be up to twice the size as the group of full adopters.
- “Non-adopters” are all other crops in each year, ranging from close to 100 percent in earlier years to 14 percent of crops in 2000.
3.4 Key assumptions and data used
The area sown to rice in NSW has generally increased throughout the period 1986 to 2002, with an average area sown of 128,000 ha. There have been considerable annual fluctuations in the area sown to rice varying from 85,000 ha in 1991 to 184,000 ha in 2001 due mainly to water allocations and seasonal conditions (Singh et al. 2005).
The price of rice used for each year was the average unit value of rice across all grades. The prices were converted to constant 2002 dollars for the analysis, using the Consumer Price Index. In 2002 dollars, rice prices fluctuated between $205 per tonne and $340 per tonne, with a mean price of $263 per tonne (Singh et al. 2005).
In an on-going program, it is difficult to determine the period chosen to estimate the benefits and costs, since both are likely to continue into the future. Because of issues related to the availability of unambiguous data, the stream of investments analysed relates to the period 1986 to 2002. That is, the evaluation being carried out is on the basis of “What if the program had been stopped at the end of the 2002 season?” It is clear that, given the participatory nature of the program, benefits would continue to accrue even after the cessation of the formal investment in the program by NSW DPI and RIRDC. We assumed that the benefits would decline linearly to zero over the following ten years after the program funding was ceased.
Thus, in this analysis, the period over which benefits of the program were accounted for was from 1986 to 2012, a total of 27 years. After 2012, it was anticipated that either this program would be replaced by a new program from future research and development, or that the rest of the industry would be achieving the same productivity as those who have adopted without Ricecheck.
Discounting and compounding was applied to ensure that people’s time preference for money is appropriately accounted for in the analysis. All benefits and costs are expressed in 2002 dollars, which required past expenditures to be converted to real 2002 dollars by the GDP deflator, then compounded forward at the discount rate. All future returns and costs were discounted to 2002. These benefits and costs were discounted at a real rate of 4 percent per annum.
3.5 Estimating the benefits of Ricecheck
The benefits from Ricecheck were estimated by first estimating the unit impacts of Ricecheck per hectare, then determining the impact per crop of rice, then aggregating to measure the impact for the whole rice industry. The detailed steps in the estimates are outlined in Singh et al.(2005).
Starting first with the group who fully adopted Ricecheck, the yield benefits from achieving the different number of checks in Ricecheck were estimated from Figure 1, compared to the baseline without Ricecheck. Using these yield gains and the average rice price each year (in constant 2002 dollars), the gross benefits (in dollars per ha) of achieving from one to eight of the key checks were estimated. As illustrated in Figure 1, these benefits declined over time as the “without Ricecheck” levels increased. The costs of involvement in Ricecheck recommendations and the direct costs of adopting different numbers of checks each year were then deducted from the gross benefits of adoption to give the net benefits per ha from achieving different numbers of checks each year.
With an average rice crop size of 29.5 ha, the net benefits per crop were calculated, and the total benefits in each year were then estimated by summing over the crops achieving from one to eight checks (Table 2 above). The total net benefits from the group of farmers adopting Ricecheck are estimated to have been $114,000 in 1986, rising to a peak of $3.38 million in 1995 (Table 6). As the area sown to rice, the price of rice and the number of crops in Ricecheck varied from year to year, the total benefits varied annually.
Table 6: Benefits and Costs of Ricecheck
($’000, 2002 dollars)
Benefits |
Total costs |
||||
Full adopters |
Informal adopters |
Awareness adopters |
Total benefits |
||
1986 |
$114 |
$96 |
$20 |
$230 |
$44 |
1987 |
$187 |
$154 |
$30 |
$371 |
$59 |
1988 |
$531 |
$469 |
$118 |
$1,119 |
$134 |
1989 |
$743 |
$642 |
$143 |
$1,528 |
$150 |
1990 |
$844 |
$693 |
$107 |
$1,643 |
$178 |
1991 |
$733 |
$610 |
$111 |
$1,453 |
$176 |
1992 |
$925 |
$745 |
$101 |
$1,771 |
$176 |
1993 |
$1,406 |
$1,189 |
$237 |
$2,832 |
$181 |
1994 |
$2,260 |
$2,004 |
$519 |
$4,783 |
$181 |
1995 |
$3,382 |
$2,947 |
$691 |
$7,020 |
$181 |
1996 |
$2,086 |
$1,794 |
$396 |
$4,277 |
$190 |
1997 |
$1,718 |
$1,442 |
$274 |
$3,433 |
$189 |
1998 |
$1,949 |
$1,642 |
$315 |
$3,906 |
$187 |
1999 |
$1,966 |
$1,654 |
$315 |
$3,935 |
$186 |
2000 |
$2,167 |
$1,834 |
$366 |
$4,367 |
$184 |
2001 |
$1,658 |
$1,305 |
$135 |
$3,098 |
$186 |
2002 |
$882 |
$713 |
$108 |
$1,703 |
$186 |
The benefits to the two groups of farmers using partial adoption of Ricecheck, namely informal and awareness adopters, were also significant (Table 6), accounting for over half of the total benefits in most years. The total benefits to these two groups of informal adopters of Ricecheck are estimated to have been $116,000 in 1986, rising to a peak of $3.64 million in 1995.
The total benefits (in constant 2002 dollars) are estimated to have increased from $230,000 in 1986 to a peak of $7.02 million in 1995, with an annual average over the 17-year period of $2.79 million per year (Table 6). The benefits to partial adopters account for 50 percent of the total estimated benefits over the whole period. Although the area under rice increased over time, there are fewer benefits from the project in later years because an increased number of checks would have been achieved without program. Thus, from the peak of benefits in 1995, the Ricecheck program has produced a declining level of net benefits over time.
3.6 R&D investment in Ricecheck
The R&D investment in Ricecheck includes the direct expenditure by the Rural Industries Research and Development Corporation (RIRDC) and the in-kind contributions from the extension and research staff of the NSW DPI in the development and promotion of the Ricecheck program over the period to 2002. All costs are considered in estimating the total costs, and are expressed in 2002 dollars, using the GDP deflator. The annual R&D investment in Ricecheck varied from $44,000 in the first year to a peak of $190,000 in 1996, and an annual average of $163,000 throughout the period since 1986 (Table 6). The total investment (in nominal dollars) was $3.77 million, almost 94 percent of which was labour costs (Singh et al. 2005).
3.7 Returns to investment
The economic analysis was carried out for the investment over the period 1986 to 2002, with benefits continuing, but declining to zero, over the following ten years to 2012.
Combining the flows of costs and benefits, the analysis of the investment in Ricecheck is shown in Table 7. At a real discount rate of 4 percent per annum, with the present value of the costs at $3.7 million and the present value of the benefits at $67.8 million, the Net Present Value of the Ricecheck program is $64.0 million. The benefit-cost ratio is estimated as 18.0:1.
Given the level of success that Ricecheck achieved and the actual benefits considered in the analysis, it is not possible to calculate an annual internal rate of return, as the program gave returns greater than its costs from the first year of investment. Any positive discount rate would have given a positive return. However, if the level of adoption had been only 8% of the actual adoption achieved, and all other relationships applied accordingly, the program would have given an internal rate of return of more than 20 percent per annum.
Table 7: Results of Benefit-Cost Analysis*
Present value of costs |
($'000) |
$3,773 |
Present value of benefits |
($'000) |
$67,779 |
Net Present value |
($'000) |
$64,006 |
Benefit-cost ratio |
18.0 |
* At a real discount rate of 4 percent per annum
These results indicate that the funds invested since 1986, by both NSW DPI and RIRDC (and its predecessors), and the time invested by rice farmers, has been a sound investment. The returns to the rice industry have been $18.0 for every dollar invested in the program (whether in cash or in kind), which is likely to have been higher than many alternative uses for those funds.
3.8 Sensitivity Analysis
Sensitivity analysis was used to demonstrate the effects on returns of changes in discount rate, and in the rate and extent of adoption (Table 8). The results are also sensitive to the assumption about partial adoption. If only those formally and fully adopting Ricecheck obtained any benefits, then the benefit-cost ratio would have been 8.9 rather than 18.0. A benefit cost ratio of 10.8 would have been obtained if it had been assumed that the ‘without Ricecheck’ farmers achieved 52 percent of the checks known to them (as did the ‘with Ricecheck’ farmers) rather than the assumed rate of achievement of 41 percent (Table 4). Examination of different lengths of time over which benefits are received from Ricecheck, different costs of adopting key checks and different discount rates showed that the results are relatively insensitive to these assumptions.
Table 8: Sensitivity of Results to Changing Values of Selected Parameters
Benefit-cost ratio |
|
Partial adoption |
|
Partial adoption included |
18.0 |
No partial adoption |
8.9 |
Without-Ricecheck scenario |
|
Achieve 80% of benefits of key checks (41%) |
18.0 |
Achieve 100% of benefits of key checks (52%) |
10.8 |
Achieve 60% of benefits of key checks (31%) |
20.2 |
Length of benefits from investment to 2002 |
|
To 2012 |
18.0 |
To 2002 |
16.2 |
To 2020 |
19.2 |
Costs of adopting checks ($ per ha per check) |
|
$5.02 |
18.0 |
$6.00 |
16.8 |
$4.00 |
19.2 |
Discount rate |
|
4% real |
18.0 |
8% real |
16.1 |
2% real |
19.0 |
The assumptions on partial adoption and without-Ricecheck scenarios, then, are the key assumptions that affect the results of the analysis. In both cases, we believe that there is strong evidence that partial adoption is indeed occurring at a significant level, and that the process of being involved in Ricecheck both informally and at the level of awareness, means that farmers capture benefits from Ricecheck even though they achieve fewer checks than if they were full members.
4. Discussion and implications
The distinctive feature of the Ricecheck program is the identification of “key checks”, the achievement of which is expected to lead to higher yields in rice production. The focus on the extension effort is to identify these key checks, to make farmers aware of their importance through group meetings and to encourage farmers to monitor and record their achievement of these checks.
The Ricecheck program has clearly had a significant impact on the productivity of the rice industry since its inception in 1986. The Ricecheck program, requiring adoption of key checks, close monitoring and record-keeping of rice crops, has increased the extent to which farmers closely monitor their crops. In this study, the benefits that have been measured are the improved yields that follow from meeting the key checks of the Ricecheck program.
While farmers have clearly become better at meeting key checks over time, the level of information that they would have had without the Ricecheck program has also increased. The benefits have been measured not from the base of productivity that existed in 1986, but from an estimate of what information the farmers would have had on the rice-growing technologies if there had not been a Ricecheck program. It is clear that rice research and extension programs would have continued even if there had been no Ricecheck program, so an allowance is made for that increased knowledge during the period of the analysis. It is estimated that the awareness of the importance of key productivity parameters would have been almost the same as with Ricecheck by the year 2002. However, the extent to which farmers could meet those key checks would have been lower without the scrutiny and discipline required in the Ricecheck program. Nevertheless, the benefits of achieving a given number of checks through Ricecheck reduced over the period of the analysis, because of the increasing knowledge that would have been available in the absence of Ricecheck.
Another feature of Ricecheck is that the cost of the farmers’ time in adopting those key checks is a significant input into the process. Indeed, farmers involved in Ricecheck contributed a total of $5.0 million of their time (at an annual average of $294,000) to the Ricecheck program in their districts over the period since 1986. In addition, once they moved to achieve the key checks, they had a further investment, averaging $5.02 per hectare, to meet some of those checks Thus, farmer resources are a key input to the process.
The present value of the investment in Ricecheck over the period from 1986 to 2002 is $3.77 million (in real 2002 dollars). The results indicate that a benefit-cost ratio of 18.0 has been achieved even with less than 20 percent of the farmers formally adopting the full Ricecheck program in any given year. A substantial share of the benefits we have estimated to flow from Ricecheck are those captured by the group of farmers who only utilise Ricecheck information in an informal way and hence capture about half the potential benefits from the program. It is apparent that any efforts to increase formal adoption of the Ricecheck program will lead to significant benefits to farmers, industry, community and the environment.
It is, of course, difficult to extrapolate from these results to other extension programs, even to other “key check” programs. The reasons for this lie in the singular nature of the Australian rice industry. First, it is located within a relatively limited geographical area, more so than most other broadacre cropping industries. Second, the high yields from the irrigated industry mean that yield advantages from new technologies are likely to be larger in absolute or physical terms than in lower-yielding dryland crops. Third, the commonality of technologies used in different regions of the rice industry means that the total number of crops involved is likely to be larger than for extension programs for many other crops. Fourth, the “closed-loop” nature of the industry, whereby the rice processing industry is directly related to the grower, and the production of rice through the Ricegrowers’ Co-operative Limited mean that the industry is often less disparate and fragmented than other industries. Finally, the small size of the industry, averaging approximately 146,000 ha in the ten years to 2002, means that new technologies can be known relatively quickly among all growers, as industry figures are in close contact with a large proportion of people in the industry.
Overall, however, the success of the Ricecheck program in improving rice yields demonstrates the advantages of integrated extension and research activities. Extension activity benefits from the integrated support of research, and research benefits from the guidance of extension to ensure that it addresses key issues for the farmers.
References
ABARE (2004), Australian Commodity Statistics 2004, Australian Bureau of Agricultural and Resource Economics, Canberra.
Lacy, J. (1998), “Learning from farmers – the check approach”, in Proceedings of the 9th Agronomy Conference, Charles Sturt University, Wagga Wagga, pp 58-65.
Lacy, J. (2004), 2004 Ricecheck Recommendations, NSW Department of Primary Industries and Rural Industry Research and Development Corporation, Finley.
Singh, R.P., Brennan, J.P and Lacy, J. 2005, An Assessment of the Economic, Environmental and Social Impacts of Ricecheck Extension Program in NSW, Research Report No. 28, NSW Department of Primary Industries, Yanco. (http://www.agric.nsw.gov.au/reader/10550)