|
|
|
|||

Department of Agriculture and Food Systems
|
||||
|
||||
|
|
|
|||
Department of Agriculture and Food Systems
|
||||
|
||||
|
|
Agribusiness Review - Vol. 7 - 1999Paper 7 Longitudinal analysis of dairy farm income and expenditure in New Zealand:
|
| Cit = total farm cost of input I at time t, |
| TCt = total cash expenditure at time t, |
| TFI t = total farm income at time t and |
| i = 1 to N cash expense type. |
In order to make data comparable over time, all milk production figures were converted to milksolids (milkfat x 1.74) and, where appropriate, total farm income and cash expenditures were converted to 1996 New Zealand dollars using the consumer price index (Lincoln University, 1998) . Some of the inter-year variation in values may be associated with sampling rather than real effects on costs and income as different farmers participated in the survey each year.
The input-cost and input-income ratios (ICRs and IIRs) were computed for nine major farm expenditure items -- administration, animal health, breeding and herd testing, dairy shed, electricity, feed and grazing, fertiliser, repair and maintenance and interest payments. Total cash costs include all relevant costs for which data were available for the entire period of analysis.
Figure 1 - Trends in interest rates and milk solids prices (1996 NZ$) 1972/73 - 1996/97
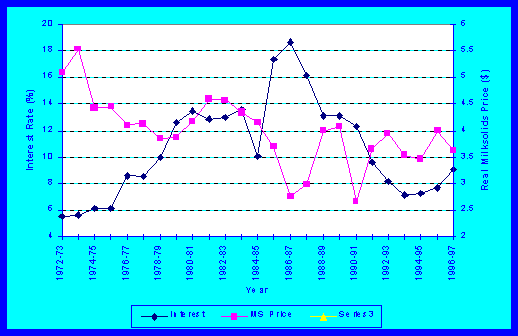
New Zealand's economy was deregulated in 1984/85 at a time when nominal interest rates were more than 17%. These further increased to a record 18.7% in 1986/87 (Figure 1) . With market adjustments taking effect, interest rates steadily declined to about 7% in 1993/94, before rising slowly to 9.1% in 1996/97.
Farmers enjoyed high milksolids (MS) prices in real terms and some input subsidies (for example, fertiliser) along with concessionary interest rates for land and livestock purchases in the early 1970s. Milk returns peaked to NZ$5.53 (1996 prices real terms) per kg MS in 1973/74 (Figure 1) .
Dairy farmers received no direct subsidies on milk payments because their market prices were always above the trigger level. Milksolids returns have generally trended downward since 1978/79 due to variation in international prices for dairy products and exchange rate movements. The MS price sank to just NZ$2.76 in 1986/87, a year following the floating of the exchange rate.
Deregulation fully exposed dairy farm returns to external shocks and the MS price has become volatile as a result. International demand for dairy products, exchange rate relativities and Dairy Board/Company investment policy (e.g. retaining earnings to build a new factory) exert a strong influence on the farm-gate MS price. Domestic factors, other than exchange rate via Reserve Bank have limited effect on the MS price besides more than 90% of milk production is exported.
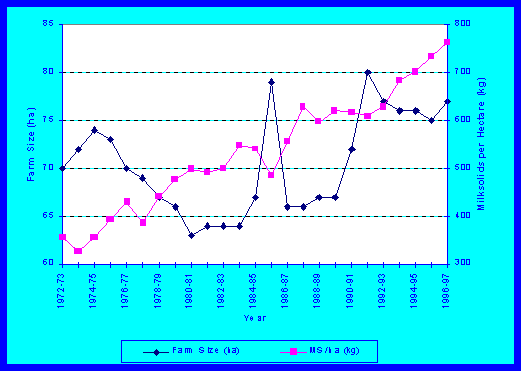
While herd size increased steadily, MS per cow has fluctuated somewhat due to the seasonal impact of weather (e.g. drought in 1988/89) and possibly due to lower farm inputs such as in 1986/87 when the MS price plummeted. Milksolids per ha, on the other hand, has been less volatile and continued to increase steadily in most years, particularly after deregulation as farmers concentrated their efforts in enhancing farm efficiency in order to reduce the impact of lower MS returns. The trends in MS/ha mostly followed those for stocking rate, indicating this variable rather than MS/cow drove increases in farm productivity. This is consistent with the heavy emphasis that the New Zealand Dairy Board Consulting Officers have placed on pasture utilisation and stocking rate (Stritchbury, 1994) .
Figure 2 - Relationship between herd size and milk solids per cow (1972/73-1996/97)
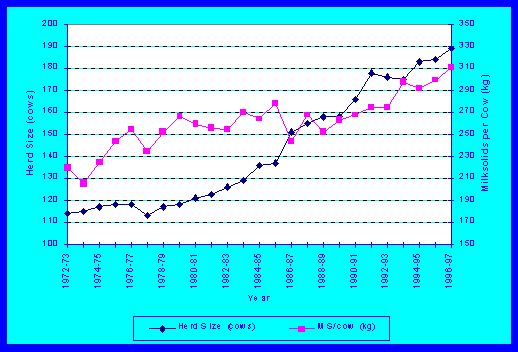
Figure 3 - Trends in milk solids per cow and stocking rate (1972/73-1996/97)
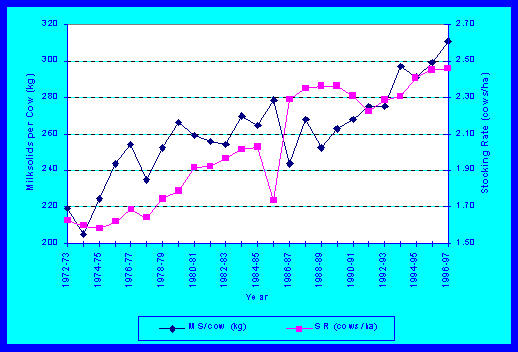
Figure 4 - Trends in farm size and farm productivity (MS/cow), 1972/73-1996/97
Total cash expenditure has corresponded closely to changes in total farm income since 1972/73 (Figure 6) . In years with higher farm income (both on a total and a per cow basis) farm cash expenses tended to increase and vice versa (Figures 6 and 7) (r=0.99). However, adjustments in cash costs were relatively more erratic than changes in farm income, meaning farmers spent a smaller proportion of extra income on farm inputs. The correlation between total farm income and cash expenditure with MS/kg payout was negative but modest (r=-0.5) indicating, as expected, reduced expenditure in years with lower payouts. However, a higher per kg MS payout did not necessarily mean higher farm income/expenditure (Figure 8) .
Between 1972/72 and 1997/97 administration costs remained within a narrow band of 2-3% of total farm income but fluctuated between 3.5-5.6% of cash expenses (Figure 9) . Administration costs were relatively high during the first three years of deregulation as the Goods and Services Tax (GST) were introduced in October 1996 and increased levels of user pays' began to apply. In recent years, farmers have tightened their belts' and gradually reduced costs to the level achieved in the early 1970s.
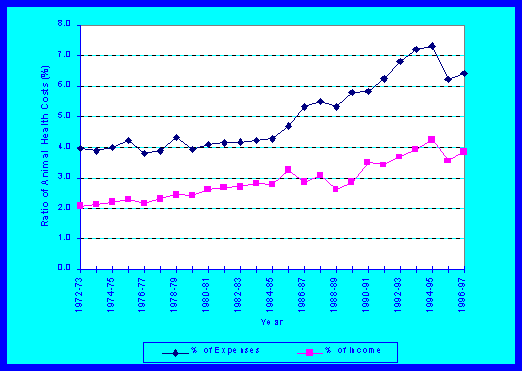
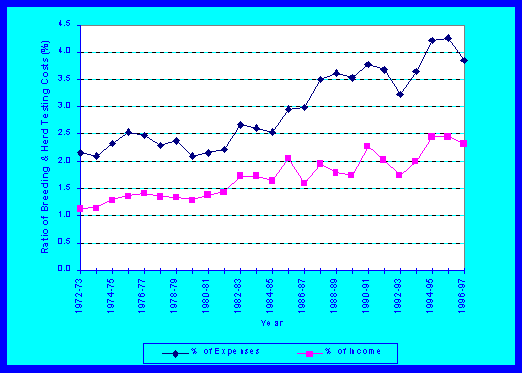
Animal health costs have steadily increased over time both in proportion to farm income and total cash expenses (Figure 10) . They accounted for more than 6% of cash expenditure and around 4% of farm income in the 1990s. This may be associated with the greater animal stresses associated with higher stocking rates and per cow productivity. Likewise, breeding and herd testing costs also increased over time (Figure 11) . This was associated with proportionately more cows being subjected to tests as well as increased use of reproductive interventions such as Controlled Internal Drug Release (CIDRs) devices (eg. MacMillan et al. , 1993; MacMillan 1995) . Gains in dairy cow productivity over time reflect genetic improvement as well as improved feed management (Parker & Holmes, 1997 ). In proportionate terms, breeding and herd testing costs doubled over the study period, as a share of both total cash costs and farm income.
Figure 6 - Relationship between farm productivity and stocking rate (1972/73 - 1996/97)
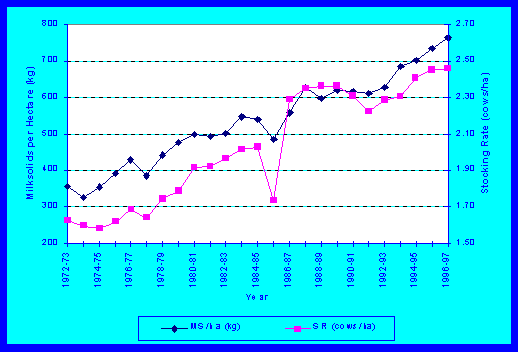
Figure 7 - Farm income vs. cash expenses per cow for an average dairy farm (1972/73 - 1996/97)
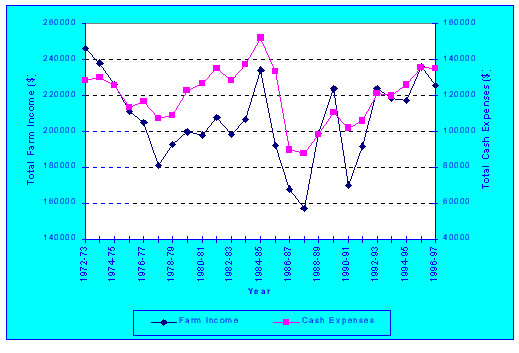
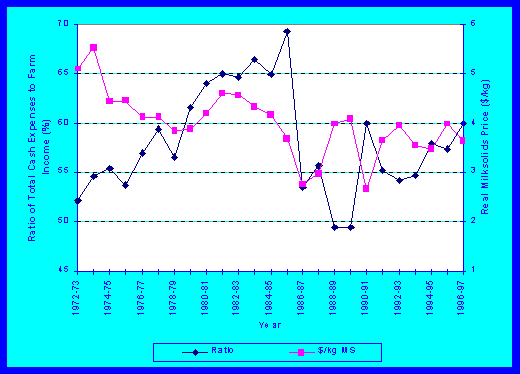
Figure 8 - Trends in real milk solids prices and ratio of total cash expenses to farm income
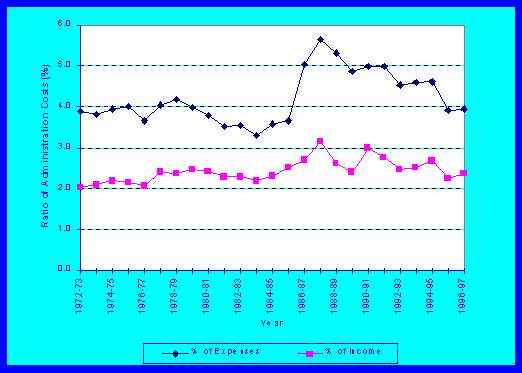
Figure 9 - Share of administration cost in total farm income and cash expenditure
Figure 10 - Share of animal health costs in total farm income and cash expenditure
Dairy shed costs have stabilised to around 1.5% of farm income and less than 3% of cash costs (Figure 12) . Although milk parlour size has increased in terms of sets of milking cups, farmers have benefited from cost reductions in cleaning agents, possibly due to economies of scale through bulk purchases as well as new technology.
Figure 11 - Share of breeding and herd testing costs in total farm income and cash expenditure
Similarly, electricity costs have also been contained within a narrow band, with the exception of the initial years of deregulation (Figure 13) . This has been achieved despite increased use of electrical equipment such as fences, milk refrigeration units and irrigation pumps.
Figure 12 - Share of dairy shed costs in total farm income and cash expenditure
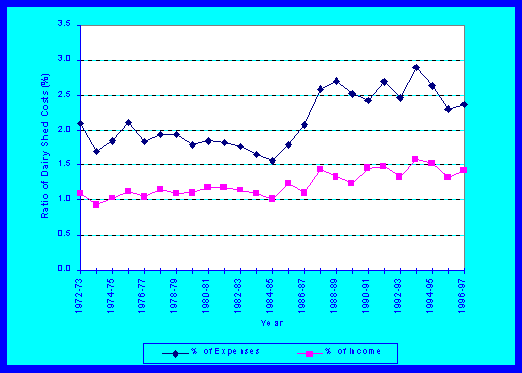
Figure 13 - Share of electricity costs in total farm income and cash expenditure
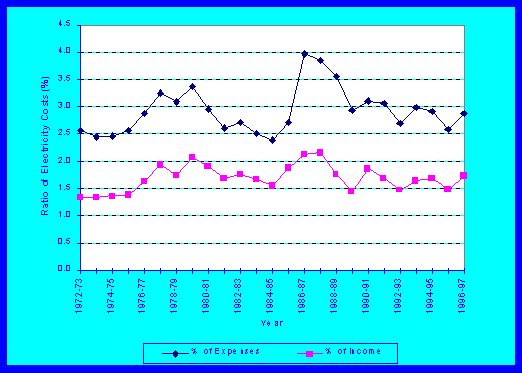
Figure 14 - Share of feed and gazing costs in total farm income and cash expenditure
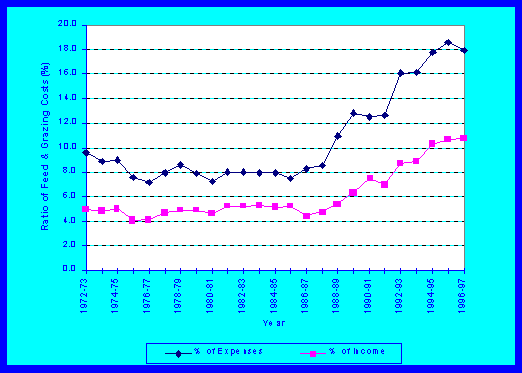
Feed and grazing costs took an upward turn after 1987/88 and had doubled as a proportion of total cash expenses and of farm income by 1996/97 (Figure 14) . Farmers have increased the use of supplementary feed, opted for more off-farm grazing and used more nitrogen fertiliser to increase the feed supply to their milking cows and replacements (Penno, 1998) . Per cow and farm productivity increases have been modest over this period, raising concerns amongst some industry commentators that the efficiency of feed utilisation, particularly pasture, declined over the decade. On the other hand, some farmers have reached a pasture supply "feed barrier" (Bryant, 1990) and, other than through buying more land, are unable to increase farm productivity except by using non-pasture feeds and using more off-farm grazing (Edwards & Parker, 1994) .
Fertiliser accounts for about 18% of total cash expenditure and 10% of farm income (Figure 15) . Like those for feed and grazing, fertiliser costs have contributed to higher farm productivity but there may be some instances where farmers are using more fertiliser than can be economically justified. For example, benefits from further increasing Olsen phosphorus test levels above 30 are small when MS prices are less than $3.80/kg (Thomson et al. , 1993) .
The share of repairs and maintenance (R&M) costs in total cash costs declined during the 1990s (Figure 16). This may be due to the "mining" of earlier investment in soil fertility and land improvements made when MS prices were higher as well as greater use of contractors instead of owning and maintaining farm machinery. In addition, improvements in race construction, fencing and water supply technology, along with increased farm scale, are all likely to have contributed to savings in R&M expenditure.
Figure 15 - Share of fertiliser costs in total farm income and cash expenditure
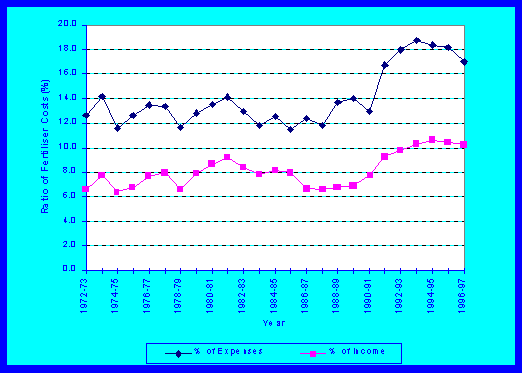
Figure 16 - Share of repair and maintenance costs in total farm income and cash expenditure
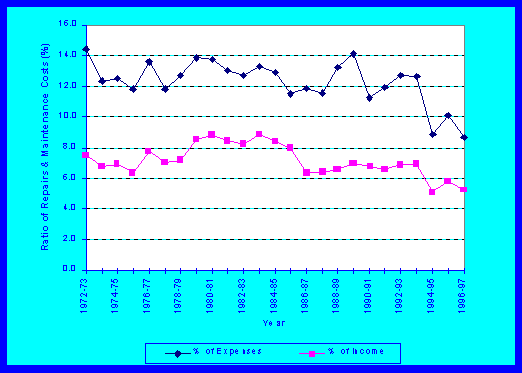
Figure 17 - Share of interest costs in total farm income and cash expenditure (1972/73 -1996/97)
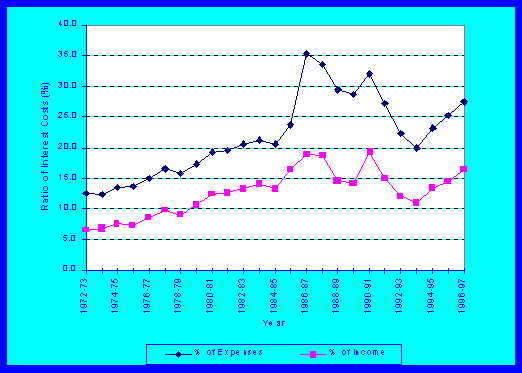
Finally, the variation in interest costs has been marked over the past 25 years (Figure 17) . The removal of concessionary interest rates and the market reform measures in during the 1980s (Figure 1) meant interest charges accounted for an all time high 35% of total cash costs and 19% of farm income in 1985/86. Despite the increased financial pressures relatively few dairy farmers were forced to sell by rural lenders.
The previous 25 years confirm that New Zealand dairy farmers face little choice but to (a) further increase farm and herd size, (b) improve cost efficiency through new technology, economies of scale and better management practice and (c) demand the New Zealand Dairy Board and its associates increase the farm-gate MS price through product differentiation and process efficiency. Increasing feed and fertiliser costs are a concern but the trend data suggests farmers have resorted to these because they had exploited the productive potential of existing pastures. Increased stocking rate, larger cows (because of increased Friesian-Holstein genetics) and higher per cow production have all increased feed demand. A commensurate increase in feed supply, from improved pastures, better pasture utilisation, more fertiliser and pasture substitutes (including off-farm grazing) has therefore been required to increase total farm MS output. While some of these actions increased input costs, farmers made savings in other areas in order to keep cash costs in the range of 50-60% of total income.
Dairy research needs to find ways to improve the effectiveness of additional inputs, and in reducing their unit cost, as these are vital to sustaining farm productivity. For example, Stantiall's (1999) survey of a sample of dairy farmers revealed that farmer' knowledge of using feeds was very poor. Improving farmers' knowledge and skills in dairy cow nutrition and in business management (particularly marginal analysis) of benefits from extra inputs (see Ferris and Malcolm, 1999) will be a critical factor in ensuring farm viability into the new Millenuum.
The effects of changes in land price have been excluded from this study but they have an important influence on dairy farm profitability. Rauniyar et al. (1998) reviewed changes in dairy land prices over the period 1990-1997 and showed the sharp increases in land values between 1992/93 and 1994/95 were not associated with improved MS prices. Rather, they were based on a combination of factors including expected high future MS prices, lower interest rates, the low cost of entry to new suppliers, and continuation of capital gains in land values. These dynamics have now changed and dairy land prices are realigning to economic worth of milk production. As a consequence some farmers are under considerable financial pressure because their capital structure imposes high fixed costs on their business.
The analysis presented in this paper reflects industry averages and trends - these should be interpreted with caution. The survey sample farmers include both outstanding and poor farmers, and it is notable that some farmers have very successfully increased inputs, productivity and profit over the 1990s despite fluctuations in MS prices. These farmers provide benchmark examples for others to aspire to in terms of dairy farm business management.
Dairy farmers in New Zealand have retained competitiveness in milk production by expanding herd size, containing and reallocating farm expenditure, and using new technology. They have been able to achieve higher productivity by containing administrative, repairs and maintenance, electricity and dairy shed costs over time.
However, gains in productivity could not have been achieved without incremental increase in fertiliser, feed and grazing and finance costs. Capitalisation of land values in the late 1980s and the first half of the 1990s along with the larger capital outlay required for a dairy farm contributed to a steady reduction in the number of dairy farm through to the early 1990s.
A small increase in farm numbers between 1992 and 1996 reflected new entrants to the industry through conversions from less profitable, sheep and beef cattle farms and some cropping enterprises. Dairy farmers face an on-going challenge in containing overhead costs in the future and need to continue to adopt productivity enhancing farm inputs (including improved management practices) in order to keep pace with a highly competitive and externally exposed market environment.
Overall this also means that most farmers have to progressively move toward a more intensive production system, although some may be able to lower inputs and increase profit through a high cow number-low output per cow strategy.
Bryant , A.M. (1990). Optimum stocking and feed management practices, Proceedings of Ruakura Farmers' Conferen ce, 55-59.
Edwards , N.J. and Parker, W.J. (1994). Increasing per cow milksolids production in a pasture-based dairy system by manipulating the diet: A review. Proceedings of New Zealand Society of Animal Production , 54 : 267-273.
Ferris , A. and Malcolm, B. (1999). Sense and nonsense in dairy farm management economic analysis. Paper presented at the 43 rd Annual Conference of Australian Agricultural and Resource Economics Society Conference, Christchurch.
Johnston , W.E. and Frengley, A.G. (1994). Economic adjustments and changes in financial viability of the farming sector: the New Zealand experience, American Journal of Agricultural Economics , 76 : 1034-1046.
LIC (1997). Dairy statistics 1996-97 . Livestock Improvement Corporation, Hamilton.
LIC (various years ). Economic survey of factory supply dairy farmers 1972/73 to 1996/97), Livstock Improvement Corporation, Hamilton.
Lincoln University (1998). Financial budget manual 1998 , E.S. Burtt (ed), Department of Farm and Horticultural Management, Lincoln University, Canterbury.
MacMillan , K.L., Taufa, V.K., and Day, A.M. (1993). Combination treatments for synchronising oestrus in dairy heifers. Proceedings of the New Zealand Society of Animal Production, 53 :267-273.
MacMillan, K.L. (1995). Reducing the use of induced calving. Ruakura Dairy Farmers' Conference, 36-41.
NZDB (various issues). Annual report. New Zealand Dairy Board, Wellington.
Parker , W.J. & Holmes, C.W. (1997). How much must the average farm produce in 2010 in order to maintain its present level of net income? Dairyfarming Annual , 49 : 25-33.
Penno , J.W. (1998). Principles of profitable dairying. Ruakura Dairy Farmers' Conference , 1-14.
Rauniyar , G.P., Parker, W.P. & Dooley, A.E. (1998). Trends in dairy farm sales and factors influencing dairy land prices in New Zealand (1990-97). Proceedings of the Annual Conference of the New Zealand Agricultural and Resource Economics Society (Inc.) , AERU Discussion Paper No. 146, Lincoln University, Canterbury, 239-246.
Stantiall , J. (1999). Facilitating learning: enhancing dairy farmer competence through workshops. Unpublished MApplSc thesis, Massey University.
Stritchbury , J. (1994). Better dairy farming - the consulting officer service. In Lab Coats to gumboots: The stories behind the significant events in New Zealand animal production . Occasional publication No. 13, New Zealand Society of Animal Production, 55-72.
Thomson , N.A., Roberts, A.H., McCallum, D.A., Judd, T.G., Johnson, R.J. (1993). How much phosphate fertiliser is enough? Ruakura Dairy Farmers' Conference , 30-35.
Participants in the annual economic survey of factory supply dairy farmers are selected through a random stratified sampling method. They represent dairy farmers throughout New Zealand. To be eligible a farm must: (a) milk 30 or more cows and supply to a dairy factory; (b) derive at least 75% of gross income from dairying; (c) have available suitable double entry accounts covering the previous 12 month period; (d) not employ a sharemilker (for owner operators); and (e) not supply town milk. Farmers remain in the survey for up to four years, with a new group entering the sample each year. An equal number of 50:50 sharemilker and owner-operator responses are used. The survey questionnaire is updated every year as new issues arise or extra information becomes available.
The Livestock Improvement Consulting Officers (COs) are advised of the names of survey sample farmers. They contact the selected farmers between April and September each year and invite them to participate in the survey. Prior to 1994/95 COs collected an estimate of the most recent year's financial data but since 1994/95 actual account data has been used.
Source SourceSource: Economic Survey of Factory Supply Dairy Farmers 1996-97, Livestock Improvement Corporation, Hamilton, 1997
|
Contact the University : Disclaimer & Copyright : Privacy : Accessibility |
|
Date Created: 04 June 2005 |
The University of Melbourne ABN: 84 002 705 224 
|