|
|
|
|||

Department of Agriculture and Food Systems
|
||||
|
||||
|
|
|
|||
Department of Agriculture and Food Systems
|
||||
|
||||
|
|
Agribusiness Review - Vol. 8 - 2000Paper 2 Price Risk Management for Australian Broad acre Farmers: some observationsRoss Kingwell June 2, 2000 SummaryThis article briefly explores the nature of price risk faced by Australian broad acre farmers and outlines some farm management ramifications of price risk. The article describes the variation in price risk across time and across commodities. The underlying distributional form of prices faced by farmers is shown to have important ramifications for farm management. The likelihood of increases in price risk over the coming two decades is also discussed.
IntroductionCommonly when people talk of risk they mean the possibility of loss or harm. However, strictly speaking, this exposure to adversity is only part of risk. It is downside risk. More generally, risk refers to a range of uncertainties (upside and downside) that affect a person's welfare. Farmers faces many risks ( Krause, 1995 ). The two most commonly mentioned risks tend to be yield and price risk, although as mentioned later, there are several other important sources of risk affecting farm businesses. This article concentrates on price risk faced by broad acre farmers in Australia. The article comprises four sections. The first section mentions briefly the main types of risk affecting farm businesses. The second examines price risks for some main commodities produced by broad acre farms. The implications for farm management of these price risks are discussed. A third section discusses future price risk. A final section offers some conclusions about price risk faced by Australian broad acre farmers. Farmers' Price Risk in ContextFarm businesses face many risks. Price and yield risk are among the more important yet there are several categories of risk including:
In the specific area of price risk farmers need to know:
Price Risks in Broad acre FarmingAn examination of price risk in broad acre farming in Australia reveals some key findings: Price risk varies according to enterpriseThe price risk a farmer faces depends on the enterprise mix of the farm. For example, wool producers in the 1990s have faced less price risk than wheat farmers. The prices faced by wool producers have been consistently low whereas wheat prices have been subject to greater fluctuation. However, the long term experience of farmers, as evidenced by data for the period 1970 to 1997 in table 1, is that wheat and wool prices have similar variability. A caveat to this is that price differences between types of wheat or wool are overlooked in using the data sourced from ABARE. For example, it is known that price variability is much greater for finer wool types (less than 20 micron) than broader wools ( Murrell, 1991 ). Hence, in practice the price risk faced by a farm business will not only depend on the general enterprise mix but also on the specific form of each enterprise (eg fine wool versus broad wool production).
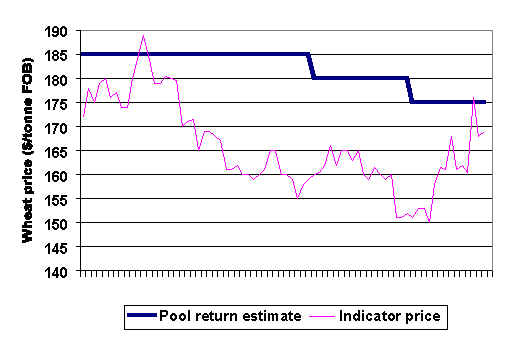
Table 1: Measures of price risk faced by Australian farmers: coefficients of variation of de-trended real prices for various agricultural commodities (%) a Source: Based on an annual price series published in ABARE Australian Commodity Statistics 1998 and earlier issues as well as ABS data. Coefficients of variation were calculated using de-trended real prices. Price risk varies through timeThe price risk associated with any particular commodity does change through time. For example, from 1970 to 1983 wheat price variability was greater than that for wool. However, the reverse was true in the period 1984 to 1997. Hence, the price risk faced by a farmer depends not only on the main enterprise of the farm (eg wheat versus wool) but also on the period during which the farmer is responsible for managing the farm. Price risk for wool and wheat in the 1970s, for example, was much greater than price risks for these commodities in the 1990s. Commodity prices can also alter substantially throughout a production period as illustrated in Figure 1 for AWB wheat prices in 1999. The indicator price varies by up to $40 per tonne over the period. However, the pool return estimate price varies by only $10 per tonne. As an aside, a farmer could respond to this variation in indicator prices by using the AWB's target price service. A farmer could nominate a target price and tonnage to deliver, and when the forward market achieves this price, the AWB would activate a forward contract of the farmer's choice. Figure 1: Price variation for wheat in 1999 from March 1999 to August 1999
A farm's enterprise mix subdues or heightens the effect of price riskTypically broad acre farming involves combining several enterprises. The degree to which price movements of the commodities move together (i.e. price correlation) can weaken or strengthen the effects of price risk. Table 2 presents a price correlation matrix for various agricultural commodities. Results indicate that price movements are far from being perfectly correlated. Wool and wheat on balance have off-setting price movements. This means that years of high (low) wheat prices tend not to be associated with years of high (low) wool prices. Movements in lupin prices are also not strongly correlated with wheat or wool price movements. Hence, maintaining a portfolio of enterprises with off-setting price movements will lessen the overall price risk faced by the farm business. However, in practice it is difficult for a farmer to choose an appropriate portfolio of enterprises. For example, historical price relativities may not be the best indicator of future price relativities. Further, reducing price risk is one of many management aspirations and enterprise selection needs to be influenced by these other considerations.
Source: Based on an annual price series for the period 1984 to 1997 published in ABARE Australian Commodity Statistics 1998 and earlier issues as well as ABS data. Is price risk more important than yield risk?Most historical analyses of price and yield risk point to yield risk being particularly important in dryland farming systems. The data in Table 3 point to crop yield variability in some Australian States, particularly Queensland, being very high in the 1990s. However, in some States, notably Western Australia and South Australia, yield variability appears to be relatively less important than price variability, at least for the major crop, wheat. One caveat is that, because the data refer to State-wide yields, in some areas actual yield risk faced by farmers will be higher than indicated by this data. Further, even within a region there is yield variation due to a variety of factors such as slope, soil and spatial variability of rainfall. Hence, whether farmers' price risk is more important than their yield risk depends on the location of their farm, the years over which they farm and the major enterprise mix of their farm.
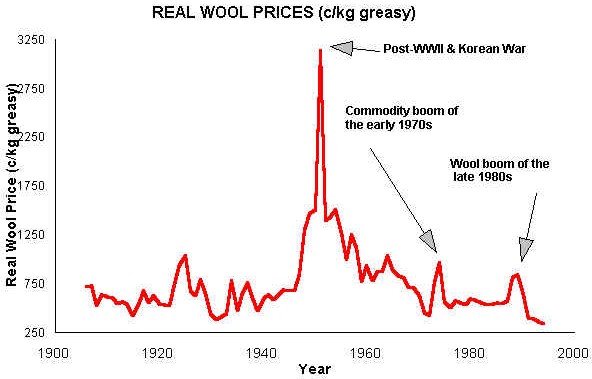
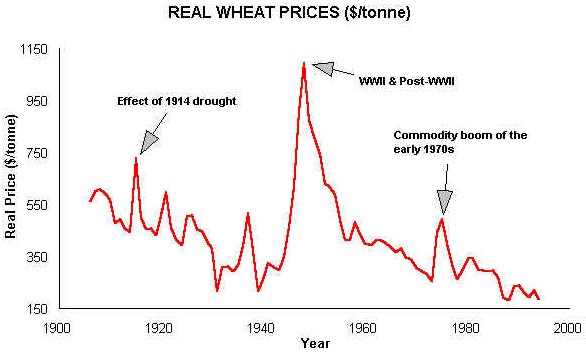
Table 3: Measures of yield risk faced by Australian farmers for major agricultural crops: coefficients of variation of de-trended yields (%) Sources: Based on de-trended yield series published in ABARE Australian Commodity Statistics 1998 and earlier issues, plus data in various Year Books for each State. The pattern of price risk mattersA conventional view of commodity prices is that they follow a bell-shaped distribution (see figure 2). In such a distribution most prices received by the farmer are close to the average price and the farmer has an equal chance of receiving a price higher or lower than this average price. Figure 2: Two different patterns of price: hypothetical distributions for wheat However, analyses of wool and wheat prices reveal that their distributions, particularly for wool, are not the typical bell-shape. Rather their distributions are positively skewed. There is a greater chance of receiving a lower price than a higher price, yet there are brief periods of very high prices. Viewing historical prices (especially for wool) reveals there are fairly long periods of relatively low prices and much briefer periods of very high prices. Since 1906 very high wool prices have been observed for only a small number of years in the late 1940s and early 1950s, and high prices have occurred in 1924, 1925, 1973, 1974, 1988 and 1989 (see figure 3). A study of Victorian wool prices ( Bardsley and Olekalns, 1996 ) from 1885 until 1969 suggests sharp but brief booms in wool prices are expected about once in 30 years. Figure 3: Historical movements in real wool prices (c/kg) For wheat very high prices were recorded in the decade following World War II and other years of high prices were 1915, 1921, 1937 and 1974 and 1975 (see figure 4). For wheat and more especially for wool there are long periods when prices are fairly low or moderate and in these periods price changes between years are not dramatic. Then there are often brief periods of very high prices. Why is this the pattern of price movements? Figure 4: Historical movements in real wheat prices ($/tonne) The answer lies chiefly in the interaction between stocks, production and demand changes. When world-wide weather conditions are favourable for wheat and wool production then there is increased supply of these commodities onto markets which usually causes a fall in their market price. In these situations it becomes relatively cheap to buy and store the commodity. If these stockholdings are large enough then they in turn continue to depress prices. These low prices ensure that storage remains attractive and hence low prices tend to persist. On the other hand widespread unfavourable weather conditions for wheat and wool production, a rapid increase in demand, a rundown in stocks, a rapid devaluation of the Australian dollar or some combination of these changes can cause prices to jump suddenly. For example, the period of high prices for wool and wheat in the years immediately following World War II was due to the rapid increase in demand for these commodities as part of post-war reconstruction, plus there was an additional military demand for wool due to the Korean War. As pointed out by one referee, supply of agricultural commodities (eg wool) is often price inelastic in the short-run and this feature can exacerbate the price variability experienced by farmers. Another example of very high prices resulted from the 1914 drought that affected most Australian States. This severe drought led to virtually no wheat being available for export from Australia in 1915. The low production and low stocks, yet increased demand from Australia and overseas, caused wheat prices to increase sharply. Occasionally a price spike associated with a run down of stocks is interpreted wrongly as a lasting increase in demand for the commodity. This is what seemed to have happened for wool when the Minimum Reserve Price was increased from 508 c/kg in 1986-7 to 870 c/kg clean in 1988-9 (an increase of more than 70 per cent). Those responsible for setting the floor price appear to have made the classic error of interpreting the temporary price spike, caused by strong demand and a stock out, as a pronounced permanent structural shift in demand ( Bardsley, 1991 ). Implications of price patterns for farmersThe nature of the price distributions for storable agricultural commodities, like grains and wool, are that there will be infrequent price spikes. Hence, in the lifetime of a farmer there may be only a handful of years when prices are very high. These years are unique and provide a farmer with a brief "window of opportunity". Some farmers will be fortunate to experience favourable seasons when they also receive these high prices. Others will experience the high prices when seasons are poor or mediocre. Nonetheless often the profits a farmer earns in these high price years act as a store of wealth that the farmer can draw upon in subsequent leaner years. Accordingly, whatever the price risk management instruments used by a farmer it is vital that a farmer does not use instruments that limit the farmer's access to this upside price risk. The decisions made by a farmer in these periods of high prices and in the immediately subsequent years can greatly affect the future viability or prosperity of their business. Hence, one lesson from the history of price movements for wheat and wool is that a farmer can greatly affect his prosperity by capitalising on the limited number of very favourable price years he will experience as a farmer. Because these windows of opportunity are brief, often decisions will need to be made sooner rather than later and tactically rather than strategically. Although when a pronounced rundown in stocks occurs, then a farmer might prepare strategic farm plans to capitalise on the increased likelihood of higher prices often associated with lower stocks. However, more often farmers will have little anticipation of a price spike and less knowledge about the duration of the spike. Accordingly most farmers will be limited in their response to the very high prices. Land use decisions in previous seasons or borrowing restrictions will limit a farmer's ability to react to the favourable price years. A rapid switch in the farm's enterprise mix is usually not possible. Besides, investing in a large switch in enterprise mix will prove unwise if the weather-years during the price spike are unfavourable or if the brevity of the price spike significantly reduces the return on the capital purchased as part of the enterprise switch. Hence, most of the less risky yet profitable decisions will be tactical ones regarding stocking rates, crop areas, fertiliser and herbicide rates, selling options, casual labour, and the amount and timing of sheep sales, purchases and shearing. Besides the decisions made during the price spike, decisions made in the years immediately subsequent to the price spike also are important. At times the high profits earned in years with very favourable prices lull some farmers into a false belief about the profitability of agriculture. Expensive purchases of land and machinery can prove subsequently to be unwise. For example, following the commodity price spike of the mid-1970s land and machinery purchases were common. Poor seasons, more typical prices and very high interest rates saw many farmers who made these expensive purchases in the late 1970s face bankruptcy in the early 1980s. A feature of the price patterns for storable agricultural commodities are prolonged periods of relatively low to moderate prices ( Williams and Wright, 1991 ). In these periods marked price volatility is relatively uncommon and extremely low prices are rare. Hence, hedging against downside risk may not be a vitally important management issue for many producers of storable commodities. Evidence of the low probability of downside risk for wheat is the fact that the support mechanism of the Guaranteed Minimum Price Scheme for wheat was rarely invoked. Are broad acre farms particularly exposed to price risk?The latest farm survey data for broad acre farms in Australia ( ABARE, 1999 ) suggest that a majority of farms are well-structured to respond to occasional price spikes as well as price troughs. Most broad acre farms in Australia maintain high equity, have some enterprise diversity including off-farm income, and are family-based owner-operations which allows personal wages and expenditure to be more easily restricted or expanded as required by economic circumstances. Around 80 per cent of all farms have more than 80 per cent equity and about half of all farms have debts less than $50,000. The history of farming in Australia has dictated that having such little debt is a key to success ( Malcolm, 1994 ). In a recent ABARE nation-wide farm survey, all broad acre farms were ranked according to their rate of return over the period 1995/96 to 1997/98. From that survey, table 4 shows the proportion of farms in various broad acre farming regions that were ranked in the bottom 25% of rate of return across all broad acre farms. Results in table 4, plus other data regarding farm equity and debt levels, point to most broad acre farms in Western Australia currently being able to recover from a brief period of downside price risk. However, given the poor performance of many farms in the Eyre Peninsular, north central Victoria and eastern Darling Downs over the period 1995/96 to 1997/98, any price trough currently would test the viability of many farms in these regions. Such a price trough, if not offset by favourable seasons, would further expose farms that had high debts, little off-farm income and no off-farm assets to liquidate. Any prolonged price trough would exhaust the usual coping strategies of debt restructure, cost-cutting and deferment of maintenance and capital expenditures ( Gray et al. , 1993 ).
Table 4: Proportion of farms in various regions ranked in bottom 25% of farm performance a Source : ABARE Australian Farm Surveys Report 1999 Although broad acre farms in Australia are often in a financially sound position, less than a fifth of the farms have annual farm cash incomes of more than $100,000 (see table D1 in ABARE 1999 ). Hence, because many farmers do not generate large cash incomes, and because their farms are in a reasonably sound equity position, many of these farmers may see little merit in expenditure on price risk management. These farmers may not have the time or resources to profitably commit to price risk management. Farms with large cash incomes or large cash expenditures are more likely to see merit in investing in price risk management. In this regard it is worth contrasting the cotton and broad acre industries, because price risk management is more common in the cotton industry in Australia. In the irrigated cotton industry average cash costs per farm in 1996/97 were $1.2 million and average cash income was $691,000 ( ABARE 1999 ). By contrast in the broad acre industry in Australia average cash costs per farm in 1996/97 were $0.15 million and average cash income was $45,400 ( ABARE 1999 ). If the 1996/97 data are indicative of the general differences between the industries then an irrigated cotton industry farm has around 4 times the annual expenditure of an average broad acre farm and over 20 times its cash income. Hence, in the cotton industry there is much more incentive to manage price risk in order to cover greater cash costs and to protect farm profit. As pointed out by one referee, cotton growers need intra-seasonal cover because of their potentially large short-term borrowings to finance a crop. Are farmers using price risk instruments? A farm survey by ABARE (1997) reported that most grain farmers in Australia did not use any of the newly available price risk instruments but rather accepted the pooling and averaging provided by marketing boards. Only 4 per cent of farmers used futures and options, although 25 per cent used some forward selling. The forward selling was used either before sowing or at some stage in the growing season to lock in a price for their harvest. Farmers reliance on the pooling and averaging provided by marketers such as the AWB may change if the AWB loses its single-desk status. Competitors to the AWB will also offer price risk management services. In the face of this competition the AWB may not be able to retain price-pooling because those disadvantaged by pooling may accept other marketing options. Accordingly the geographical spread of wheat prices may increase as cross-subsidisation associated with pooling diminishes. Price Risk in the FutureMost price forecasts for agricultural commodities suggest that prices will continue to decline in real terms. However, the rate of decline over the next decade or so may be less than that recorded since the 1970s and greater price volatility is expected ( Tweeten, 1998 ; Pinstrup-Andersen and Pandya-Lorch, 1998 ; Rosselle and Rosegrant, 1997 ; Rosegrant and Ringler, 1997 ). The main arguments supporting these views can be summarised as:
The likelihood of greater price fluctuation points to an increased need by Australian farmers, in the future, to manage their price risk. In particular the need to hedge against low prices and capitalise on periods of very high prices seems likely to increase in the future. ConclusionsPrice risk faced by broad acre farmers in Australia is shown to depend on a range of factors. Firstly, the enterprise or commodity mix of the farm is shown to be important. Price movements of commodities can move together or against one another, and therefore the portfolio of enterprises on a farm can weaken or strengthen the price risk faced by the farm business. Secondly, the price risk associated with any particular commodity or enterprise changes through time. Hence, the period of years during which a farm is managed can characterise its price risks. For example, the 1970s was a period of high price risk for many commodities. Thirdly, the underlying distribution of commodity prices that gives rise to price risk is also shown to have important management ramifications. Storable commodities are known to have price distributions that are positively skewed. In practice this means there are infrequent price spikes. Hence, in the lifetime of a farmer there may be only a handful of years when prices are very high. These years are unique and provide a farmer with limited but crucial opportunities for profit. How farmers respond to these opportunities can affect greatly their long term prosperity. This article also touches on the degree to which price risk is more important than yield risk for any particular farm. There is no firm conclusion. The relative importance of price and yield risk is shown to depend on farm location, enterprise mix and the farming period. Also presented are the reasons why price risk for broad acre commodities is thought to increase in the next decade or so. Such an increase in price risk will lead farmers to review their price risk management strategies. Currently, many farmers seem happy to accept the price risk management, in terms of pooling and averaging, undertaken by marketers. Whether farmers in the future remain satisfied with these marketers is itself an uncertainty. ReferencesABARE , Australian Farm Surveys Report 1997, Australian Bureau of Agricultural and Resource Economics, Canberra, 1997. ABARE, Australian Farm Surveys Report 1998, Australian Bureau of Agricultural and Resource Economics, Canberra, 1998. ABARE, Australian Farm Surveys Report 1999, Australian Bureau of Agricultural and Resource Economics, Canberra, 1999. P. Bardsley , 'Wool on the brink - the public cost of underwriting the wool market', Paper presented to the 35th annual conference of the Australian Agricultural Economics Society, University of New England, Armidale, February 11-14, 1991. P. Bardsley and N. Olekalns, Wool price variability in the long run. Aust. J. Agric. Econ., 40, 51-62 (1996). I. Gray , G. Lawrence and T. Dunn, Copping with Change: Australian farmers in the 1990s, Centre for Rural Social Research, Charles Sturt University, Wagga Wagga, pp.144. M. Krause , Rural Property Planning Risk Management, Butterworth-Heinemann, Oxford, pp.144, 1995. B. Malcolm , Managing farm risk: There may be less to it than is made of it. Paper presented at a workshop on "Risk management in Australian agriculture, University of New England, Armidale, New South Wales, June 15-16, 1994. A.J. Murrell , Does the producer benefit from price stabilisation ? An empirical analysis of the Australian Wool Corporation's reserve price scheme. Unpublished MSc thesis, Faculty of Agriculture, University of Western Australia, 1991. P. Pinstrup-Andersen , P. and R. Pandya-Lorch, Recent developments and emerging issues in world food security. Choices, 3rd quarter, 4-7 (1998). W. Rijnsburger , H.Glaudemans, M. Timmermans and H. Rijkse, The World Grain Sector, Rabobank International, Utrecht, 1998. M.W. Rosegrant and C. Ringler, World food markets into the 21st century: environmental and resource constraints and policies. Aust. J. Agric. Res. Econ., 41, 401-428 (1997). S. Rosselle and M. Rosegrant, China's past, present and future food economy: Can China continue to meet the challenges? Food Policy, 22, 191-200 (1997). V.W. Ruttan , Biotechnology and agriculture: A skeptical perspective. AgBioForum 2, 54-60 (1999). Retrieved April 15, 1999 from the World Wide Web: http://www.agbioforum.missouri.edu M. Shane, T. Roe , L. Teigen and M. Gopinath, World food insecurity: a policy dilemma. Food Security Assessment, GFA-9, United States Department of Agriculture, November, 1997. L. Tweeten , Anticipating a tighter global food supply-demand balance in the 21st century. Choices, 3rd quarter, 8-12 (1998). J.C. Williams and B.D. Wright , Storage and Commodity Markets , Cambridge University Press, Cambridge, UK, 1991. |
||||||||||||||||||||||||||||||||||||||||||||||||||||||||||||||||||||||||||||||||||||||||||||||||||||||||||||||||||||||||||||||||||||||||||||||||||||||||||||||||||||||||||||||||||||
|
Contact the University : Disclaimer & Copyright : Privacy : Accessibility |
|
Date Created: 04 June 2005 |
The University of Melbourne ABN: 84 002 705 224 
|