|
|
|
|||

Department of Agriculture and Food Systems
|
||||
|
||||
|
|
|
|||
Department of Agriculture and Food Systems
|
||||
|
||||
|
|
Agribusiness Review - Vol. 10 - 2002Paper 2 The US Cattle Cycle and its Influence on the Australian Beef IndustryG. R. Griffith and A. R. Alford [1] Garry Griffith is a Principal Research Scientist, NSW Agriculture Beef Industry Centre, Armidale, a Project Leader, Beef Quality CRC and an Adjunct Professor, University of New England. Andrew Alford is a PhD scholar at the University of New England, funded by the Beef Quality CRC.
1. IntroductionAlthough there is some disagreement about the fine detail (see for example the report on Outlook 2002 in The Land , 7 March 2002, p.12), the signposts for the Australian beef industry appear to be pointing mainly in the "positive" direction in the short term. How long will this situation last and what can cattle producers, feedlot operators and meat processors do to protect themselves against the inevitable turnaround towards the "negative" direction? In this paper, one of the critical factors influencing the longer-term future of the beef market, the United States (US) cattle cycle, is described and its impacts on Australia are evaluated. 2. How does the US beef industry influence the Australian beef industry?While Australia is the largest beef exporter contributing some 25% of total beef traded in 2001 ( provisional data, USDA 2001 ), its pricing power is limited. Several factors create this situation. Firstly, Australia had only 2.6% of the world's cattle population and current beef exports represented only 2.7% of total world beef production in 2001. In contrast, the US had 9.4% of the world's cattle inventory and produced around 12,000 Kt of beef (carcase weight equivalent) in 2001, or over 6 times as much as Australia ( provisional data, USDA 2001 ). As a result small percentage changes in the US beef industry are comparatively large in the context of the Australian industry. Secondly, Australia's beef exports are centred on two major markets, Japan and the US, representing 34% and 42% of total export volumes respectively in 2001. Exports to Japan include both grass-fed and grain-fed product, while exports to the US are predominately lean manufacturing grade beef from the Northern herd. The remaining 24% of Australia's exports going to over 50 other countries ( MLA 2001c, 2002 ). These markets are highly competitive and therefore pricing power is limited. Figure 1. Beef and veal exports of selected countries, 1996-2001
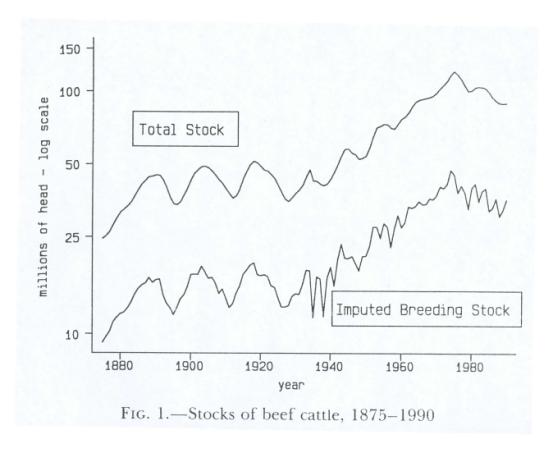
Source: USDA (2002). Thirdly, increasing exports of beef from the US compete with Australia in Pacific Rim export markets, mainly Japan and Korea. This is particularly so in the higher quality grain-fed segments. Figure 1 shows the recent trends of beef and veal exports of selected countries. The US is now the second largest exporter, although USDA (2001) expects US beef exports to decline during 2002. Thus the US is both a major market for Australian beef and a major competitor in third country markets. Activity in the US beef industry therefore is a critical factor influencing the Australian beef industry and must be taken into account by Australian beef producers and agribusiness participants in planning future activities. Monitoring of the US beef industry requires an appreciation and understanding of the US cattle cycle that is a central element of that industry. 3. What is the US Cattle Cycle?US cattle cycles have been studied extensively with data on the US cattle inventory being kept from as early as 1875 (see Figure 2). A famous paper in the economics literature by Rosen, Murphy and Scheinkman (1994, p.468) referred to the US cattle cycle as ".among the most periodic time series in economics". These cattle cycles have been characterised by a cycle length of about 10 years, with individual cycles varying from 8 to 13 years ( Mathews, Hahn, Nelson, Duewer and Gustafson 1999 ; Mundlak and Huang 1996 ). Two major components are identified in the cattle cycle - an expansion phase and a liquidation phase ( Tomek and Robinson 1990 ). As expected, the expansion phase of the cycle tends to be more regular than the liquidation phase since expansion in the herd size is constrained biologically by the time it takes to rear heifers to expand the breeding herd. Typically this expansion phase ranges from 6 to 8 years and the liquidation phase ranges from 3 to 8 years ( McCoy and Sarhan 1988 ). During more recent cycles, the liquidation phase has tended to shorten. Figure 2. US cattle cycles, 1875-1990
Source: Rosen et al. (1994, p.469) Figure 3 illustrates the duration of the four most recent US cattle cycles. Cattle cycles are defined to start from the low point in the cattle inventory. For example, the most recently completed cycle began in 1979 with the US cattle inventory reaching a low of 110.8 million head, before expanding to a peak of 115.4 million head in 1982. Then followed a liquidation phase, which resulted in the cattle population reaching a low of 95.8 million head in 1990. The current cycle commenced at this time after which herd rebuilding recommenced with a peak in cattle numbers in 1996 of 103.5 million head. USDA (2001) report that the US cattle population at 31 January 2002 had fallen to 96.7 million head, some 7% below the 1996 peak. Figure 3. Duration of U.S. cattle cycles since 1958
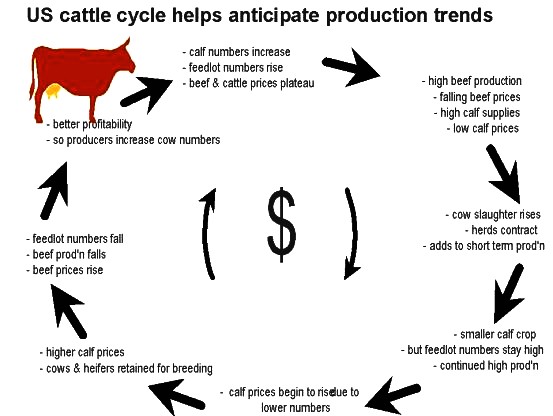
Source: USDA (2002); McCoy and Sarhan (1988). Two points arise from this graph. First, the four cycles differ substantially in terms of length, amplitude and shape, reflecting the different external influences on the US beef industry during these different time periods (see section 5 below). However there seems to have been a general flattening out of the cycle during the more recent periods. This pattern seems also to hold in US cattle prices (see Figure 5 below). Second, the fact that US cattle numbers changed by some 20 million head during the 1980s emphasises the relative sizes of the US and Australian beef industries. Even the relatively small change of about 8 million head during the 1990s is large compared with the total Australian herd. The cyclical nature of the US beef industry is explained in part by the way in which producers form expectations about future prices and profits and the adjustment time that is required due to the biological constraints of beef production systems. This sequence of influences and decision-making and the resultant cyclical pattern is shown in Figure 4. The left of this figure is about where the US industry was in the late 1980s and where it is now, while the right is about where the US industry was during the mid 1990s. As cattle prices rise, producers form opinions about current and future profitability and decide between withholding heifers from slaughter to increase their breeding herd capacity, and increasing slaughters to benefit from current prices. By holding on to females the number of stock available for slaughter is restricted and this induces price increases up until the expanded breeding herd produces sufficient beef to meet demand. Beyond this point, prices falter and the industry enters the liquidation phase. The duration of this liquidation phase is greatly dependent upon economic factors including consumer demand and price as well as input costs to the beef system ( Tomek and Robinson 1990 ). One aspect of this cyclical pattern that economists tend to focus on is the "myopic" or short-sighted view of cattle producers - they forget what they did about 10 years ago (at a similar stage of the cycle), and what the inevitable consequences were when the cycle turned around. If cattle producers remembered what happened in the past they may well make decisions that dampen down this cyclical behaviour. There seems to be some evidence of this occurring in the last cycle shown in Figure 3. Figure 4. US cattle cycle helps anticipate production trends
Figure 5 shows the strong inverse correlation between beef prices and the total cattle inventory in the US, over the last three cycles. There appears a tendency for producers to sell more stock when prices are high and hold on to stock when prices are low ( Mathews et al. 1999 ). It appears that generally cattle slaughterings lag price turning points by about two years ( McCoy and Sarhan 1988 ). Obviously producers are constrained by biological factors to respond quickly to price signals. Figure 5. The relationship between cattle prices and US cattle inventory, 1970-2001
Source : USDA (2000,2002). Cattle prices are represented by the slaughter steer price, Choice 2-4, Nebraska Direct, 1100-1300 lb. Prices are deflated using 1983/84 = 100. Factors that influence the timing and scale of the US cattle cycle include not only the biological constraints of the production system, but also external factors. Such factors include weather, grain exports and prices, consumer demand and government programs. For example, it has been shown that US government cropping policies affect the cattle cycle by causing land to move from pastures to cropping or vice versa ( Bobst and Davis 1987 ). An expansion in grain exports or the impact of drought on grain prices directly impacts upon the profitability of the grain fed cattle industry ( Mathews et al. 1999 ). In this way a particular phase of the cattle cycle is induced to extend or shorten. Some of these factors are discussed in more detail in section 5 below. Apart from these immediate influences, researchers have identified several fundamental or longer-term factors that have shaped recent US cattle cycles. These include:
A number of indicators have been identified to monitor the US cattle cycle and to determine when a turning point might be signalled. These include ( Lesser 1993 ):
A detailed explanation of these factors and their critical values are outlined in various sources including McCoy and Sarhan (1988) and Lesser (1993) . These various cattle cycle indicators used together effectively measure herd build up and therefore potentially signal price breaks. It has been suggested that the use of such tools by US producers in planning beef production has been partly responsible for the lower annual herd expansion rates of the last two cycles (1.2%) compared to the expansion rates in previous cycles' (4%) ( Mathews et al. 1999 ). 4. The role of the US corn price and US feedlotsGrain markets are an important influence upon the US beef industry. Within the US almost all young steers and approximately one-third of heifers are finished in feedlots where the major grain fed is corn ( Rosen et al. 1994 ). Therefore the price of corn as a major input to US beef production is an important factor affecting US beef production and profitability. The steer price to corn price ratio has been used as one of the lead indicators of changes in the US cattle cycle. Typically a steer-corn price ratio of 25 has been a point of equilibrium with a decline in this ratio preceding a drop in beef prices which is followed by a liquidation of the US cattle herd ( Lesser 1993 ). Figure 6 shows the strong negative correlation between the "profitability" of US beef production as measured by the steer to corn price ratio, and the build up or liquidation of the US beef herd. A low steer to corn price ratio (indicative of high costs of production) tends to be associated with or precede a high cow slaughter to cow inventory ratio (indicative of herd liquidation). In fact when the cow slaughtering measure is lagged a year, that is the steer to corn price ratio is used as a lead indicator, the correlation between the two ratios is (r = - 0.70). Figure 6. The relationship between the US steer price to US corn price ratio and the stage of the US cattle cycle as measured by the cow slaughter to cow inventory ratio .
Source: USDA (2000, 2002). 5. Evidence of the influence of the US beef industry on AustraliaThe impact of the US cattle cycle on the Australian industry is evident in the strong links between US prices and prices received by Australian beef producers. For example, in Figure 7 the ratio of US cow slaughterings to total cow inventory is compared to prices received by Australian producers. A strong inverse relationship is clearly evident - high cow slaughterings coincide with low beef prices being paid to Australian producers (r = - 0.6). An increasing proportion of cows being slaughtered indicates a run down in the breeding herd and a subsequent reduction in beef supply over the next few years. Therefore a high proportion of cow slaughterings normally occurs near the trough in prices; the period of industry pessimism. These cows are used for manufacturing beef, which displaces imports from Australia and New Zealand in the US domestic market and, to a lesser extent, competes with exports from Australia and New Zealand in third country markets. Figure 7. The relationship between the proportion of the US cow herd that is slaughtered and Australian beef prices.
Source: ABS (2001); AMLC Statistical Review (various issues); MLA (2001c); USDA (2000). Australian cattle prices are represented by the average price for steers (300-320 and 320-400 kg). Australian prices are deflated using 1989/90 = 100. ). A second key indicator relating to the US cattle cycle and its impact on the Australian industry is the activity in US feedlots. An expansion in the placements of steers on feed and a consequent expansion in fed beef production indicates a build up in herd size. This normally occurs near the peak in prices; the period of industry optimism. This directly affects the Australian industry since US feedlot product provides high quality beef that competes with Australian grainfed beef in key Asian export markets like Japan. If however increased numbers of heifers are placed on feed, this indicates a reduction in potential breeding numbers and a run down in the herd. The net result of these various influences in the US market and in third country markets is that US cattle prices and Australian cattle prices move closely together. This is shown in Figure 8, where the correlation coefficient between the two price series (which are not corrected for exchange rate movements) is (r = 0.67). Figure 8. US and Australian saleyard cattle prices.
Source: ABS (2001); AMLC Statistical Review (various issues); MLA (2001c); USDA (2000, 2002). Australian cattle prices are represented by the average price for steers (300-320 and 320-400 kg). Australian prices are deflated using 1989/90 = 100. US cattle prices are represented by the slaughter steer price, Choice 2-4, Nebraska Direct, 1100-1300 lb. US prices are deflated using 1983/84 = 100. 6. Given the existence of the US cattle cycle and its influence on Australia, why doesn't it tell the whole story?While the US cattle cycle has been shown to have a major influence on the Australian beef industry, there are a variety of external factors that modify that influence to some extent. Many of these factors are highly unpredictable and thus cause forecasting for the Australian beef industry to be difficult. Many of the following examples of these external factors are in "play" this year. Health IssuesConsumer confidence and trade opportunities are heavily dependent upon human and animal health considerations. Recent examples of this include BSE and FMD. MLA (2001a) identified food safety as a significant factor in beef consumption in Korea, where in the first four months of 2001 beef consumption declined by 9% to 117,000 tonnes. This has been directly attributed to Korean consumer concerns regarding BSE and FMD in Europe and the weaker Korean economy ( MLA 2001a ). Similarly, the BSE scare in Europe caused a 27% drop in beef consumption across the European Union in the last quarter of 2000 ( MLA 2002 ). Likewise the occurrence of FMD in the beef exporting countries of Argentina, Uruguay and Brazil in 2001 ( MLA 2001a ) will have an impact of beef markets and therefore mask to some extent the impact of the US cattle cycle upon the Australian beef industry. Exchange RatesVarious industry analysts have highlighted the advantage of a low Australian dollar against the currencies of our major beef export destinations. For example between 1996 and 2001 the Australian dollar depreciated against the US dollar by approximately 30%. Against the backdrop of a 30% rise in US domestic beef prices, the consequence of the exchange rate change was that Australian cow prices increased by approximately 80% on a c/kg dressed weight basis to late 2001 ( MLA 2001a ). As another example, in 2000 the Australian dollar depreciated 15% against the yen making Australian beef very competitive in Japan. Exports to this destination rose 4% in 2000 while the value of beef exports to Japan were 12% higher than in 1999 ( Riley et al. 2001 ). This depreciation against the yen continued into 2001. The following graphs highlight the impact of a depreciating Australian dollar against the US dollar and the Japanese yen and the corresponding value of beef cows and steers in terms of Australian saleyard prices. The same effect is shown in Figure 8, where the influence of the exchange rate has clearly been to exacerbate the rises and falls in cattle prices in Australia compared to what has happened in the US market. Figure 9. The inverse relationship between Australian exchange rates (Australian:US and Australian:Japanese) and Australian cattle saleyard prices.
Source: Reserve Bank of Australia (2001); MLA (2001c); AMLC (various issues). Note: saleyard prices are in 1990/91 dollars Climatic InfluencesClimatic factors in Australia or other countries such as the US obviously impact upon the profitability of the Australian beef industry. For example, the severe drought in eastern Australia during the early 1980s clearly had a disruptive influence on the relationships portrayed in Figures 7 and 8. During the early part of 2001 the US experienced unusually severe winter conditions that resulted in a significant decline in US feedlot productivity. Cattle in feedlots used extra energy for maintenance causing a significant impact on marketings from feedlots over this period, particularly in carcase weights (Figure 10). It has been estimated that these severe conditions resulted in a 6% to 7% decline in US beef production in the first quarter of 2001 ( Kay 2001 ). Figure 10. Comparison of the average dressed carcase weights of US cattle during the first six months of 2000 and 2001 .
Source: USDA (2002). Industrialisation PatternsA point made above was the greater "industrialisation" of the US beef industry (which leads to a greater proportion of fixed costs in total costs and more inelastic responses to price changes) as a possible explanation of the general flattening out of the US cycle during more recent periods. This pattern has also occurred in Australia. The feedlot sector has expanded rapidly in the last decade and recent research has shown that feedlot supply elasticities are much more inelastic than earlier studies have found ( Griffith et al. 2002 ). Also, more output now comes from larger, specialist producers. In 1999/2000, almost two-thirds of the Australian beef herd was carried in the larger, specialist beef properties in northern Australia ( Riley et al. 2001, p.3 ), compared with less than 40 per cent in the early 1970s ( Reeves 1982, p.15 ). Differences in the patterns of "industrialisation" between Australia and the US is another factor influencing the impact of the US cattle cycle on Australia. General Economic and Political ConsiderationsEconomic conditions in Australia and the countries that import Australian beef have a significant influence upon the Australian beef industry. Over the last decade, live cattle exports from Australia and particularly the Northern beef industry have increased from 98,000 head in 1990/91 to 858,814 head in 2000/01 (Figure 11). This has occurred as a consequence of growing demand for beef in Asia. In 2000/01 some 63% of live cattle exports were to Asian countries most notably Philippines, Indonesia and Malaysia. In response to shrinking cattle populations in these countries governments have encouraged live cattle imports so as to maintain some component of the beef production chain within their domestic economies ( Paradice and Linnegar 1994 ). The growth of the live cattle trade has reduced to some extent the dependence of the Northern herd on the US market, although it is reasonable to assume that the price of live cattle still reflect the price of beef on world markets. Figure 11. Australian live cattle exports, 1991-2001
Source: MLA, Statistical Review (various issues) Economic conditions have however greatly influenced this trade. For example, the deterioration in Asian economies during 1997 and 1998 resulted in significant falls in Australian beef exports to those nations ( ABARE 2001 ). In the case of the Australian live cattle trade, cattle exported to Indonesia fell by 90% between 1997 and 1998 as a consequence of the downturn in the Indonesian economy. Trade restrictions also provide another external factor that may partially mitigate the effect of the US cattle cycle upon the Australian beef industry. For example, Korea agreed to remove a variety of trade restrictions effecting beef imports over 2001. MLA (2001a) predicts that the longer-term outlook for Australian beef exports to Korean is positive with the potential for beef imports to reach 320,000 tonnes by 2005, compared with 200,000 tonnes in 2000. Australia held 30% market share of Korean beef imports in 2000 ( MLA 2001a ). On the other hand, Australian exports hit the US quota level last year and are expected to hit the 2002 level even sooner (MLA 2001b). Industry are currently attempting to develop allocation policies so that exports can be maintained throughout the year, but whichever way they go, prices will be adversely affected. These various external factors interact to partially mitigate the influence of the US cattle cycle upon the Australian beef industry. The examples of current factors that are impacting upon the beef market make forecasting of the current US cattle cycle and its impact on the Australian beef industry difficult. 7. Present OutlookThe current US cattle cycle commenced from an inventory low in 1990 (95.8 million head) to peak at the start of 1996 with 103.5 million head. In that same year drought occurred through key beef regions of the US ( Mathews et al. 1999 ), and subsequently cattle numbers have fallen approximately 7% to 96.5 million head at the commencement of 2002 ( USDA 2002 ). At the same time beef prices have increased by approximately 30% over this period. In response to higher prices, US beef production has increased over 5% since 1996. This was achieved mainly through higher average dressed weights, which increased 9.4% over the period, since the total number of cattle slaughtered was relatively stable. These higher slaughter weights have been attained in part by a 10.9% increase in net placements in feedlots. Meanwhile US cow slaughterings have decreased significantly from 7.274 million head in 1996 to 5.761 million head in 2001, but heifer slaughterings increased over the period as producers have taken advantage of the higher beef prices ( USDA 2001 ). Market analysts in the US and in Australia have been anticipating an easing in heifer slaughter numbers for two years now. This would indicate a move towards a herd build up phase ( MLA 2001b ) and would signal the start of a new cattle cycle. However this has not yet happened. The USDA in its recent Livestock, Dairy and Poultry Situation and Outlook has described the background to the current US beef industry situation. During 2000 drought covered many of the cow-calf production areas of the US with drought continuing into the winter over the Pacific Northwest and Southwest Texas. Along with the severe winter and dry conditions in spring 2001, hay stocks were depleted. Attracted by the relatively good feeder cattle prices, the poor feed outlook induced producers to sell calves early including heifers to maintain their breeding herds. The impact of a high cow slaughterings ratio on subsequent year's total cattle numbers over the last three cattle cycles is illustrated in Figure 12. Figure 12. Annual US cattle numbers compared to the annual cow slaughter to cow inventory ratio in the US .
Source: USDA (2002). During 2001, US cattle numbers continued to fall. Also, high levels of yearling heifers in feedlots indicate that herd rebuilding has not yet commenced ( USDA 2002 ). If herd rebuilding were to commence this year then heifers from this year's crop will not breed until 2003, enabling cattle inventories and beef production to begin to expand in 2005. This is an example where drought conditions appear to have extended the current cattle cycle, so that the current cycle is expected to be the longest of the last four. 8. ConclusionsIt is suggested in the previous discussion that while the US cattle cycle contributes significantly to the broad direction of the Australian beef industry, various external factors, such as local seasonal conditions and exchange rates, create short-term alterations to the impact of the US cycle upon the local industry. However it is important to appreciate that the US cattle cycle is still a critical component in both Australian and US market analyses such as those undertaken by MLA and the USDA. The evidence available indicates that the US industry is very close to the end of the current cycle that commenced in 1990. The expectation is that cow and heifer slaughter rates will start to fall later this year, the breeding herd will expand, greater quantities of beef will begin to flow onto the market in about three years, and prices will start to ease after that. The change in the cyclical pattern of US prices will flow over into the Australian beef market, as shown in Figure 8. Interested readers can follow USDA analyses of US data as it unfolds in the monthly Livestock, Dairy and Poultry Situation and Outlook reports, available on the USDA website at http://www.ers.usda.gov/ldp/circular/2001/ . While this downward cyclical pattern can be anticipated and planned for, the worry is that many of the external factors that influence the length and amplitude of the cyclical downturn will not be working to the advantage of the Australian beef industry. The $AU/$US exchange rate is rising and is projected to reach approximately $0.60 by mid 2003. This is about a 20% appreciation, and if it did eventuate, it would place considerable downward pressure on saleyard prices for cattle in Australia, irrespective of any cyclical downturn. As well, interest rates are on the rise and there seems to be a sharply rising probability of a major drought. The National Climate Centre is putting the probability of a new El Nino event at 50-50, "double the normal level of risk." ( Macey 2002 ). Both of these factors would put pressure on farm profitability and would induce a greater turnoff of cattle, again putting downward pressure on saleyard prices. In terms of implications for the Australian industry and industry advisors, it would seem prudent that any planning at farm or industry level should take account of the cyclical nature of the beef industry. In practical terms this might mean farmers considering new or further investment in the beef industry should incorporate development budgets that reflect cyclical prices over time frames equivalent to the US cattle cycle of 10 years on average. Farm business plans should be robust enough to withstand expected price troughs created by these cycles. All cattle producers should remember that saleyard prices in Australia fell about 50% during the last cyclical downturn. However, as anyone who has done a SWOT analysis will know, for every threat there is an opportunity. The relatively regular US cattle cycle has some very positive implications for farmers who are able, and make the effort, to anticipate beef price booms through opportunistic or short-term beef production. 9. References(Please note that the publisher accepts no responsibility for the accuracy of the web site addresses noted in these references). Australian Bureau Of Statistics (2001), Consumer Price Index, Australia . Catalogue No. 6401.0. [Online] Available : http://www.Abs.Gov.Au/Ausstats/Abs@Nsf/Lookup/Nt00000d46/ Australian Meat and Livestock Corporation (Various Issues), Statistical Review, Amlc, Sydney. Bobst , B.W. And Davis, J.T. (1987), "Beef Cow Numbers, Crop Acreage, And Crop Policy", American Journal Of Agricultural Economics , 69, Pp. 771-776. Griffith , G.R., Coddington, A. And Murdoch, S.M. (2002), "Beef Feedlot Supply Response", Paper Presented To The 46th Annual Australian Agricultural & Resource Economics Society Conference, Canberra, 13-15 February. Kay , S. (2001), The New U.S. Beef Industry (And Its Impact On New Zealand Beef Farmers). A Presentation To New Zealand Beef Producers, May 21-24. Lesser , W.H. (1993), Marketing Livestock And Meat, Food Products Press, Binghamton, Ny. Macey , R. (2002), "El Nino Threatens To Steal The Rain, Again". [Online] Available: http://www.smh.com.Ao/News/0202/10/National/National19.Html Mathews , K.H.Jr, Hahn, W.F., Nelson, K.E., Duewer, L.A. And Gustafson, R.A. (1999 ), U.S. Beef Industry: Cattle Cycles, Price Spreads, And Packer Concentration , Market And Trade Economics Division, Economics Research Service, U.S. Department Of Agriculture. Technical Bulletin No. 1874. McCoy , J.H. And Sarhan, M.E. (1988), Livestock And Meat Marketing, Third Edition, Van Nostrand Reinhold Co., New York. Meat & Livestock Australia (2001a), Market Briefs - Korea, March 2001, Meat & Livestock Australia Limited, Marketing Information Services, Sydney. Meat & Livestock Australia (2001b), Market Briefs - North America, March 2001, Meat & Livestock Australia Limited, Marketing Information Services, Sydney. Meat & Livestock Australia (2001c), Statistical Review July 2000 - June 2001, Meat & Livestock Australia Limited, Marketing Information Services, Sydney, September. Meat & Livestock Australia (2002), Australian Cattle And Sheep Industry Overview , February 2002 , Meat & Livestock Australia Limited, Marketing Information Services, Sydney. Mundlak , Y. And Huang, H. (1996), "International Comparisons Of Cattle Cycles", American Journal Of Agricultural Economics , 78 (4), Pp.855-868. Paradice , J. And Linnegar, M. (1994), "Live Cattle - An Industry Success Story", Meat And Livestock Review , Australian Meat And Live-Stock Corporation, Sydney, August, Pp. 2-8. Reeves , G. (1982), "The Australian Beef Cattle Industry: A Perspective On Demand And Supply Forces In Domestic And Overseas Markets", In Papers On The Australia Beef Cattle Industry , Bae, Canberra. Reserve Bank Of Australia (2001 ), Exchange Rates And Reserve Bank Foreign Exchange Operations, Occasional Paper No.13. Reserve Bank Of Australia. [Online] Available: http://www.Rba.Gov.Au/Statistics/Op13-Upd.Xls And http://www.Rba.Gov.Au/Statistics/Ocerdisk.Xls . Riley , D., Gleeson, T., Martin, P. And Delforce, R. (2001), Australian Beef Industry 2001 , Abare Research Report 01.8, Canberra. Rosen , S., Murphy, K.M. And Scheinkman, J.A. (1994), "Cattle Cycles", Journal Of Political Economy , 102 (3) Pp. 468-492. Tomek , W.G. And Robinson, K.L. (1990), Agricultural Product Prices, Third Edition, Cornell University Press, Ithaca. U.S. Department Of Agriculture (2000), Red Meat Yearbook (94006), Economic Research Service, [Online] Available: http://www.Ers.Usda.Gov/Data/Sdp/View.Asp?F=Livestock/94006/ U.S. Department Of Agriculture (2001), Livestock And Poultry: World Market And Trade, Foreign Agricultural Service, Circular Series Dl&P (October, And Previous Issues). [Online] Available: http://www.Fas.Usda.Gov/Dlp/Circular/2001/01-10lp/Toc.Html . Accessed 18/3/2002 U.S. Department Of Agriculture (2002), Livestock, Dairy And Poultry: Situation And Outlook, Economics Research Service, Ldp-M-92 (And Previous Issues). [Online] Available: http://www.Ers.Usda.Gov/Ldp/Circular/2002/ 10. Footnotes. [1] The authors thank the Beef Quality CRC for financial assistance and Alistair Watson and Bob Richardson for constructive comments on an earlier draft. |
|
Contact the University : Disclaimer & Copyright : Privacy : Accessibility |
|
Date Created: 04 June 2005 |
The University of Melbourne ABN: 84 002 705 224 
|